ADI Global Distribution ADIG
-20.5%vs Day 1Spinoff of Resideo (REZI) · Classic Spinoff · Spun Aug 3, 2026
Expected return (11/13/2026): -22% Gain to loss: 0.2 : 1Leading North American security and low-voltage distributor carrying $1.0B of spin debt; Q3 2026 margin fell again, 2026 EBITDA guidance cut ~18% and management sees no near-term recovery; the revolver covenant tightens to 3.50x by late 2028
Current Stats
Post-Spinoff Performance
| Timeline | |
| Spinoff date | August 4, 2026 · NYSE |
| Days since spinoff | 102 days |
| Structure | Classic Spinoff |
| §355(e) window closes statutory; a tax matters agreement may bar more, and for longer | August 4, 2028 |
| Parent | Resideo (REZI) |
| Day-1 reaction | |
| Day 1 open | $21.25 |
| Day 1 return (open→close) | +3.5% |
| Day 1 price (close) | $22.00 |
| Day 1 range | $21.00 – $26.00 +23.8% spread |
| Day 1 low held? | Breached after 9 sessions to -56.9% below |
| Price levels | |
| Post-spin low (closing) | $9.82 on Nov 12, 2026 · 100 days post-spin |
| Lowest traded | $9.06 on Nov 13, 2026 · 101 days post-spin |
| Current price (Nov 13, 2026) | $10.09 |
| Returns | |
| Return vs Day 1 (close) | -54.1% |
| — range by day 1 entry theoretical bounds | -61.2% to -52.0% |
| Return vs post-spin low | +2.7% |
| First-quarter return (≈90d) | -15.1% |
| Versus benchmarks | |
| S&P 500 over same window | -2.0% |
| Shares & ownership | |
| Shares outstanding Jun 30, 2026 | 75,751,181 |
| Diluted average shares the EPS denominator | 75,751,181 |
| Free float | 68,438,365 90% of shares outstanding |
| Held by institutions | 88% insiders 0.1% |
| Volume & liquidity | |
| Traded per day 20-session median | $8.58M |
| Normal volume baseline | 579,700 shares · now 0.81x |
| Day 1 volume | 4.8x normal · first week 3.3x |
| Decay | half in 3 sessions · normal by 17 |
Computed from split-adjusted closing prices. Returns are total return — (end price + dividends received − start price) ÷ start price — with no reinvestment assumed.
Price History
Closing price, split-adjusted, with volume below. No dividends have been paid, so price return and total return are the same. Source: Yahoo Finance. Data through Nov 14, 2026.
Raw daily price & volume data
| Date | Open | High | Low | Close | Volume | Float | Turnover | Market cap | Dividend | Split |
|---|---|---|---|---|---|---|---|---|---|---|
| 2026-11-13 | $9.70 | $10.15 | $9.06 | $10.09 | 2,605,600 | 68,438,365 | 3.44% | $764M | — | — |
| 2026-11-12 | $15.46 | $15.72 | $9.79 | $9.82 | 5,695,500 | 68,438,365 | 7.52% | $744M | — | — |
| 2026-11-11 | $19.43 | $19.84 | $19.18 | $19.58 | 455,800 | 68,438,365 | 0.60% | $1.48B | — | — |
| 2026-11-10 | $19.28 | $19.73 | $18.99 | $19.07 | 377,700 | 68,438,365 | 0.50% | $1.44B | — | — |
| 2026-11-09 | $18.83 | $19.70 | $18.75 | $19.36 | 344,500 | 68,438,365 | 0.45% | $1.47B | — | — |
| 2026-11-06 | $18.25 | $18.72 | $18.01 | $18.32 | 526,500 | 75,882,959 | 0.70% | $1.39B | — | — |
| 2026-11-05 | $19.05 | $19.08 | $17.93 | $18.42 | 736,900 | 75,882,959 | 0.97% | $1.40B | — | — |
| 2026-11-04 | $18.91 | $19.51 | $18.13 | $18.91 | 613,300 | 75,882,959 | 0.81% | $1.43B | — | — |
| 2026-11-03 | $18.80 | $19.20 | $18.29 | $18.44 | 579,700 | 75,882,959 | 0.77% | $1.40B | — | — |
| 2026-11-02 | $17.79 | $18.77 | $17.60 | $18.68 | 536,100 | 75,882,959 | 0.71% | $1.42B | — | — |
| 2026-10-30 | $16.64 | $17.79 | $16.48 | $17.48 | 531,900 | 75,882,959 | 0.70% | $1.32B | — | — |
| 2026-10-29 | $17.38 | $17.97 | $17.38 | $17.69 | 367,200 | 75,882,959 | 0.48% | $1.34B | — | — |
| 2026-10-28 | $17.19 | $17.58 | $16.94 | $17.31 | 475,700 | 75,882,959 | 0.63% | $1.31B | — | — |
| 2026-10-27 | $16.47 | $17.56 | $16.42 | $17.37 | 536,300 | 75,882,959 | 0.71% | $1.32B | — | — |
| 2026-10-26 | $16.37 | $16.74 | $16.08 | $16.36 | 336,500 | 75,882,959 | 0.44% | $1.24B | — | — |
| 2026-10-23 | $16.66 | $16.66 | $15.87 | $16.23 | 336,900 | 75,882,959 | 0.44% | $1.23B | — | — |
| 2026-10-22 | $16.83 | $16.86 | $16.21 | $16.48 | 378,000 | 75,882,959 | 0.50% | $1.25B | — | — |
| 2026-10-21 | $16.05 | $16.87 | $16.05 | $16.55 | 464,600 | 75,882,959 | 0.61% | $1.25B | — | — |
| 2026-10-20 | $15.26 | $16.01 | $15.09 | $15.97 | 420,300 | 75,882,959 | 0.55% | $1.21B | — | — |
| 2026-10-19 | $15.73 | $16.90 | $15.09 | $15.22 | 405,100 | 75,882,959 | 0.53% | $1.15B | — | — |
| 2026-10-16 | $15.60 | $16.01 | $15.30 | $15.48 | 458,500 | 75,882,959 | 0.61% | $1.17B | — | — |
| 2026-10-15 | $15.45 | $15.86 | $15.00 | $15.70 | 571,900 | 75,882,959 | 0.75% | $1.19B | — | — |
| 2026-10-14 | $16.16 | $16.34 | $15.00 | $15.50 | 709,000 | 75,882,959 | 0.94% | $1.17B | — | — |
| 2026-10-13 | $16.59 | $17.00 | $16.12 | $16.51 | 452,200 | 75,882,959 | 0.60% | $1.25B | — | — |
| 2026-10-12 | $16.60 | $17.37 | $16.49 | $16.95 | 559,000 | 75,882,959 | 0.74% | $1.28B | — | — |
| 2026-10-09 | $17.23 | $17.87 | $16.79 | $16.80 | 313,200 | 75,882,959 | 0.41% | $1.27B | — | — |
| 2026-10-08 | $17.26 | $17.81 | $16.77 | $17.20 | 583,700 | 75,882,959 | 0.77% | $1.30B | — | — |
| 2026-10-07 | $17.47 | $17.81 | $17.23 | $17.53 | 452,300 | 75,882,959 | 0.60% | $1.33B | — | — |
| 2026-10-06 | $17.91 | $18.29 | $17.60 | $17.82 | 663,700 | 75,882,959 | 0.88% | $1.35B | — | — |
| 2026-10-05 | $17.70 | $18.05 | $17.37 | $17.62 | 679,900 | 75,882,959 | 0.90% | $1.33B | — | — |
| 2026-10-02 | $18.32 | $18.65 | $17.83 | $17.83 | 550,300 | 75,882,959 | 0.73% | $1.35B | — | — |
| 2026-10-01 | $17.99 | $18.21 | $17.11 | $17.98 | 689,300 | 75,882,959 | 0.91% | $1.36B | — | — |
| 2026-09-30 | $18.94 | $19.09 | $17.35 | $17.92 | 1,993,800 | 75,882,959 | 2.63% | $1.36B | — | — |
| 2026-09-29 | $18.79 | $19.46 | $18.39 | $19.00 | 630,000 | 75,882,959 | 0.83% | $1.44B | — | — |
| 2026-09-28 | $19.53 | $20.41 | $17.88 | $18.53 | 737,000 | 75,882,959 | 0.97% | $1.40B | — | — |
| 2026-09-25 | $20.74 | $20.85 | $19.53 | $19.55 | 573,300 | 75,882,959 | 0.76% | $1.48B | — | — |
| 2026-09-24 | $20.52 | $20.62 | $20.01 | $20.46 | 747,000 | 75,882,959 | 0.99% | $1.55B | — | — |
| 2026-09-23 | $21.11 | $21.47 | $20.42 | $20.68 | 462,900 | 75,882,959 | 0.61% | $1.57B | — | — |
| 2026-09-22 | $20.92 | $21.54 | $20.71 | $21.02 | 838,200 | 75,882,959 | 1.11% | $1.59B | — | — |
| 2026-09-21 | $21.07 | $21.38 | $20.60 | $20.92 | 663,200 | 75,882,959 | 0.88% | $1.58B | — | — |
| 2026-09-18 | $21.45 | $21.45 | $20.41 | $20.70 | 1,214,400 | 75,882,959 | 1.60% | $1.57B | — | — |
| 2026-09-17 | $21.39 | $22.31 | $21.39 | $21.64 | 828,900 | 75,882,959 | 1.09% | $1.64B | — | — |
| 2026-09-16 | $20.33 | $21.67 | $20.33 | $20.99 | 768,900 | 75,882,959 | 1.02% | $1.59B | — | — |
| 2026-09-15 | $20.46 | $20.67 | $20.03 | $20.44 | 856,900 | 75,882,959 | 1.13% | $1.55B | — | — |
| 2026-09-14 | $20.65 | $21.11 | $20.16 | $20.35 | 635,100 | 75,882,959 | 0.84% | $1.54B | — | — |
| 2026-09-11 | $21.43 | $21.61 | $20.33 | $20.53 | 713,800 | 75,882,959 | 0.94% | $1.56B | — | — |
| 2026-09-10 | $20.25 | $21.52 | $20.25 | $21.41 | 505,000 | 75,882,959 | 0.67% | $1.62B | — | — |
| 2026-09-09 | $20.63 | $21.00 | $20.17 | $20.66 | 652,800 | 75,882,959 | 0.86% | $1.57B | — | — |
| 2026-09-08 | $20.50 | $21.34 | $20.26 | $20.89 | 679,400 | 75,882,959 | 0.90% | $1.58B | — | — |
| 2026-09-04 | $20.39 | $21.33 | $20.39 | $20.65 | 384,900 | 75,882,959 | 0.51% | $1.56B | — | — |
| 2026-09-03 | $21.49 | $21.88 | $20.21 | $20.42 | 636,000 | 75,882,959 | 0.84% | $1.55B | — | — |
| 2026-09-02 | $20.41 | $21.61 | $20.39 | $21.28 | 1,005,900 | 75,882,959 | 1.33% | $1.61B | — | — |
| 2026-09-01 | $21.86 | $22.42 | $20.09 | $20.34 | 1,144,700 | 75,882,959 | 1.51% | $1.54B | — | — |
| 2026-08-31 | $22.19 | $22.65 | $21.22 | $21.87 | 1,136,900 | 75,882,959 | 1.50% | $1.66B | — | — |
| 2026-08-28 | $22.10 | $22.38 | $21.54 | $22.11 | 712,800 | 75,882,959 | 0.94% | $1.67B | — | — |
| 2026-08-27 | $21.98 | $22.33 | $21.18 | $21.88 | 610,400 | 75,882,959 | 0.81% | $1.66B | — | — |
| 2026-08-26 | $21.78 | $22.31 | $20.80 | $21.59 | 994,700 | — | 1.31% | $1.64B | — | — |
| 2026-08-25 | $21.79 | $23.05 | $21.79 | $22.27 | 763,800 | — | 1.01% | $1.69B | — | — |
| 2026-08-24 | $21.23 | $23.16 | $21.23 | $22.10 | 754,300 | — | 1.00% | $1.67B | — | — |
| 2026-08-21 | $22.47 | $23.49 | $21.09 | $21.12 | 985,500 | — | 1.30% | $1.60B | — | — |
| 2026-08-20 | $21.16 | $23.24 | $21.16 | $22.59 | 1,500,500 | — | 1.98% | $1.71B | — | — |
| 2026-08-19 | $20.82 | $21.96 | $20.26 | $21.36 | 958,800 | — | 1.27% | $1.62B | — | — |
| 2026-08-18 | $21.15 | $21.67 | $20.21 | $20.50 | 1,569,300 | — | 2.07% | $1.55B | — | — |
| 2026-08-17 | $21.41 | $22.34 | $20.56 | $21.43 | 1,689,500 | — | 2.23% | $1.62B | — | — |
| 2026-08-14 | $25.56 | $25.56 | $21.17 | $21.24 | 2,516,800 | — | 3.32% | $1.61B | — | — |
| 2026-08-13 | $23.82 | $26.58 | $22.57 | $25.82 | 1,925,800 | — | 2.54% | $1.96B | — | — |
| 2026-08-12 | $28.62 | $29.18 | $25.02 | $25.24 | 1,220,300 | — | 1.61% | $1.91B | — | — |
| 2026-08-11 | $29.49 | $30.99 | $27.03 | $27.92 | 1,507,300 | — | 1.99% | $2.11B | — | — |
| 2026-08-10 | $28.34 | $28.91 | $27.18 | $28.27 | 3,017,800 | — | 3.98% | $2.14B | — | — |
| 2026-08-07 | $26.31 | $27.46 | $26.31 | $27.03 | 819,100 | — | 1.08% | $2.05B | — | — |
| 2026-08-06 | $26.12 | $27.23 | $25.75 | $26.30 | 1,272,200 | — | 1.68% | $1.99B | — | — |
| 2026-08-05 | $22.67 | $25.75 | $22.01 | $24.98 | 1,511,000 | — | 1.99% | $1.89B | — | — |
| 2026-08-04 | $21.25 | $26.00 | $21.00 | $22.00 | 2,805,800 | — | 3.70% | $1.67B | — | — |
| 2026-08-03 | $21.73 | $23.58 | $21.73 | $22.06 | 11,700 | — | 0.02% | $1.67B | — | — |
Close is split-adjusted to current shares. It is not dividend-adjusted: dividends are listed separately, so total return is (end price + dividends received − start price) ÷ start price, checkable by hand. Volume is as-traded.
Momentum: MACD and RSI
Top: MACD (navy) and its signal line (gold); bars show the gap between them, teal when MACD is above.
Bottom: RSI over 14 days; above 70 is usually read as overbought and below 30 as oversold.
The lines start late because MACD needs 26 trading days of prices and RSI 14 before the first value.
The colored strip under the charts shows the state label day by day; hover for the state and the reason.
Both measure momentum in the price and say nothing about value. Hover for each day's arithmetic.
Source: closing prices from this site's daily price archive (Yahoo Finance), not adjusted for dividends. Data through Nov 14, 2026.
How these are calculated
Short Selling
Bars: shares sold short each day in trades reported to FINRA (off-exchange
trades, roughly half of all volume).
Line: the short share of that volume, averaged over 20 sessions.
Gold points: short interest, the shares sold short and not yet bought back,
reported twice a month, also shown as a percentage of the free float and of
shares outstanding.
Daily short volume includes market makers' routine hedging, so a change in the
share is more informative than its level. Hover for each day's figures.
Sources: FINRA; float from this site's daily share records; shares outstanding
from the company's latest quarterly filing. Data through Nov 13, 2026.
Index-Fund Holdings
Daily positions of State Street's SPDR index funds, by the fund's file date.
These are the index funds whose daily holdings can be collected; iShares and
Vanguard funds, often larger holders, publish holdings that cannot be
collected automatically and appear in the written analysis from their
quarterly filings.
Collection began on October 11, 2026. A fund that drops the stock shows as an
exit.
Source: State Street Global Advisors. Data through
Nov 12, 2026.
Update — November 12, 2026: third-quarter results, guidance cut and the scenarios rebuilt — HOLD → TRIM, target $16 → $8
Rated at the November 12, 2026 close of $9.82 (Yahoo Finance; this site’s price archive adds the day overnight). Sources: the third-quarter results release (before the open on November 12, 2026), the third-quarter 10-Q (filed the same evening), and a published transcript of the call of November 12, 2026. Earlier sections are left as published. This section grades the quarter against the tests set on October 23, 2026, rebuilds the three cases on the cut guidance, and checks the covenants again.
Overview Summary
The quarter failed the tests that mattered, and the stock halved. Revenue rose 9% to $1,306 million (5% a selling day), but the gross margin fell to 20.9%, or 20.0% without tariff refunds and a one-time inventory benefit, and 2026 guidance for standalone adjusted EBITDA was cut by about 18%, to $230–240 million. The guidance implies $28–38 million for the fourth quarter, about 3% of revenue. ADI wrote off $659 million of goodwill, and management said it does not expect “a meaningful gross margin improvement in the near term” and is planning for weak residential demand and an unfavorable mix through 2027. The stock fell 49.8% while distribution peers rose. The cases are rebuilt at $16.90, $9.26 and $3.15; weighted 10 / 55 / 35 the value is $7.89, and the target moves from $16 to $8. At $9.82 the expected return is −19.7%, in the TRIM band. Net debt is $792 million, about 3.4 times guided EBITDA; the covenants pass in the base case, and in the worst case net leverage reaches the final 3.50-times limit at the end of 2028.
Rating: BUY below $5.94 · ACCUMULATE $5.94–7.17 · HOLD $7.17–8.76 · TRIM $8.76–10.51 · SELL above $10.51 · Target $8
The quarter
| $M | Q3 2026 | Q3 2025 | Change |
|---|---|---|---|
| Net revenue | 1,306 | 1,203 | +9% (a selling day +5%; two more selling days) |
| Gross margin | 20.9% | 22.6% | −1.7 points |
| Gross margin without tariff refunds (~$4M) and the spin inventory benefit (~$8M) | 20.0% | 22.6% | −2.6 points |
| Selling, general and administrative | 202 | 190 | +6% |
| Goodwill impairment | 659 | — | |
| Net income (loss) | (655) | 26 | |
| Adjusted standalone EBITDA (margin) | 66 (5.1%) | 76 (6.3%) | −13% |
| Operating cash flow | 64 |
As reported; adjusted standalone EBITDA is the company’s definition. 2025 is carved out of Resideo; Q3 2025 revenue derived from the reported growth.
- Where the margin went. Management attributed about 0.7 point of the fall to last year’s temporary tariff pricing benefit, about 1.4 points to customer and product mix, and about 0.5 point to freight and inventory charges. Sales grew in national accounts, projects, video surveillance and power, all at lower margins, while Exclusive Brands, ADI’s own-label products, weakened; within it, low-margin wire outgrew higher-margin networking.
- Exclusive Brands is the problem. About 70% of it is installed in homes. It was tracking to very low growth in the second half until mid-August 2026; October 2026 was down in the high single digits, and management expects the rest of the fourth quarter down 5–6%.
- The impairment cut goodwill from $1,066 million to $400 million. The 10-Q gives the reasons as residential weakness, the mix shift, lower projections and the fall in the share price, and says it does not affect cash, liquidity or covenant compliance. No other asset was impaired.
- Cash held up. Operating cash flow was $64 million in the quarter; cash was $208 million and the $500 million revolver undrawn at October 3, 2026. Capital spending guidance was cut by $20 million to $50–55 million.
The tests set on October 23, 2026:
| Test | Needed | Result |
|---|---|---|
| Volume | Flat or better | ✓ Sales a selling day +5% (against an easy comparison with last year’s systems conversion) |
| Gross margin | Down no more than the 0.8-point tariff headwind | ✗ Down 1.7 points, 2.6 without one-time items |
| 2026 guidance | Held at $275–295 million | ✗ Cut to $230–240 million; revenue $4.91–4.93 billion |
| Residential AV and Exclusive Brands | No worse than flat | ✗ Falling; October 2026 down high single digits |
| Revolver and cash flow | Undrawn; positive cash flow | ✓ Undrawn; $64 million in the quarter |
| Preferred dividend | Stated | ✓ Accrues at 7% on the accumulated amount (about $2 million in the quarter) |
| Cost program | On schedule | ✓ About $60 million annualized by the end of 2026, $80 million by the end of 2027 on a run-rate basis; more being developed |
What management said on November 12, 2026
From a published transcript of the call.
- Margins: the chief financial officer said “we do not expect a meaningful gross margin improvement in the near term”. The fourth quarter’s gross margin should be about the third quarter’s without one-time items.
- 2027: no guidance until the fourth-quarter call. The planning assumes continued residential weakness, third-party growth largely offset by Exclusive Brands, and cost savings largely offset by inflation and by the absence of $24 million of 2026 tariff refunds, which implies about flat EBITDA (an estimate from those statements).
- Costs: $60 million of the $80 million program has been acted on, about $35 million of it in 2026; about $25 million more lands in 2027, and the last $20 million, tied to the systems integration, mostly in 2028. The chief executive described the last part as on track “by the end of 2027 on a run rate basis”, the chief financial officer as a full $80 million in 2028.
- Pricing: a single data system since early October 2026 shows where products are under- or over-priced; acting on it fully depends on moving every store onto one platform, around mid-2027.
- Suppliers: asked whether lower supplier rebates were caused by the spin, the chief financial officer said “the spin had nothing to do with it”; one supplier relationship was exited.
- Capital: reducing debt is the first priority. No analyst asked about the covenants.
Why the stock moved
| Price return | October 22 to November 11, 2026 | November 12, 2026 | October 22 to November 12, 2026 |
|---|---|---|---|
| ADI | +18.8% | −49.8% | −40.4% |
| Distribution peers | +1.5% | +0.4% | +1.9% |
| Resideo (former parent) | +29.3% | −6.7% | +20.6% |
| S&P SmallCap 600 (IJR) | +2.7% | −1.2% | +1.4% |
Distribution peers equal-weighted: Wesco, Fastenal, Grainger, TD Synnex and Arrow. Closes from Yahoo Finance.
- The fall was ADI’s own. Peers rose on the day; the stock fell 49.8% on 5.7 million shares, about 12 times the previous day’s volume, giving back a rise of 18.8% since the October 23, 2026 update.
- Short sellers were positioned for it. Short interest was 3.72 million shares at October 30, 2026, about 4.9% of the common shares and 8.7 days of trading, near its highest since the spin.
| Report | Settled | Short | % float | % outst. | Days to cover |
|---|---|---|---|---|---|
| First after the spin | Aug 14, 2026 | 2.37M | 3.1% | 3.1% | 1.4 |
| Latest | Oct 30, 2026 | 3.72M | 4.9% | 4.9% | 8.7 |
The latest share of float is higher than 5 of the 5 earlier reports since the spin. Short interest in shares, with its share of the float and of shares outstanding. FINRA settlement dates; figures are published about eight business days later. Days to cover is short interest divided by average daily volume, as reported by FINRA. Float and shares outstanding on or before each date, from this site's daily share records and the company's filings.
The scenarios and the asymmetry
The method is the October 23, 2026 one: 40% a ten-year cash-flow value at a 9.5% discount rate and 2.5% terminal growth, 30% a multiple of 2027 earnings and 30% a multiple of underlying 2026 EBITDA (the company’s standalone figure less the tariff refund and stock compensation), on 85.2 million shares counting the preferred as converted. The cases are rebuilt: net debt is $792 million ($1,000 million of debt less $208 million of cash), 2026 starts from the cut guidance, and the growth, margins and multiples reflect what the call said about 2027.
| Case | Published October 23, 2026 | Now | Against $9.82 | Growth 2027–2031 | Underlying margin by 2030 | Multiples (2027 earnings / 2026 EBITDA) | What it needs |
|---|---|---|---|---|---|---|---|
| Best | $27.24 | $16.90 | +72% | 4% | 6.5% | 12× / 10× | The Investor Day plan resumes in 2027 and the cost program rebuilds the margin |
| Base | $18.02 | $9.26 | −6% | 2% | 5.0% | 10× / 8.5× | About flat 2027, then slow growth; the margin recovers to 5.0%, below the 5.6% of 2023–2025 |
| Worst | $9.13 | $3.15 | −68% | 0% | 3.5% | 8× / 7× | No growth and the margin stuck near the fourth quarter’s exit rate |
Estimates. The underlying margin starts at about 3.8–4.0% in 2026 in every case. The cash-flow values alone are $19.66, $9.15 and $0.79.
One change at a time on the base case (estimates):
| Change | Value | Change |
|---|---|---|
| Margin 6.0% by 2030 (the 2023–2025 record) | $11.47 | +$2.21 |
| Margin 4.0% by 2030 | $7.06 | −$2.20 |
| Multiples 11× / 10× (the September 2026 basis) | $10.54 | +$1.28 |
| Multiples 8× / 7× | $7.72 | −$1.54 |
| Growth 4% / 0% a year | $9.78 / $8.79 | +$0.52 / −$0.47 |
| Discount rate 8.5% / 10.5% | $10.55 / $8.29 | +$1.29 / −$0.97 |
- The margin carries the value: each point of margin by 2030 is worth about $2.20 a share. With $792 million of net debt against a market value of about $840 million, small changes in profit move the equity a lot.
| Weights, best / base / worst | Value | Expected return | Gain to loss |
|---|---|---|---|
| Standard: 25 / 50 / 25 | $9.64 | −1.8% | 0.91 to 1 |
| Best guess: 10 / 55 / 35 | $7.89 | −19.7% | 0.27 to 1 |
| Stress: 10 / 40 / 50 | $6.97 | −29.0% | 0.20 to 1 |
| What the price implies, base held at 55%: 24 / 55 / 21 | $9.82 | 0% | — |
The weights are a judgment: the odds of each path over the next two to three years, revisited at each results update. They are unchanged from October 23, 2026; the cases moved instead. All values are estimates from the model.
- Why 35% on the worst case. Management expects no near-term margin improvement and plans for the mix and residential weakness to continue through 2027; Exclusive Brands, the highest-margin line, is falling faster each month; and the cost savings are offset by inflation.
- Why only 10% on the best case. It needs the Investor Day plan back on track in 2027, which management’s own 2027 planning does not assume.
- What the price implies: with the base case at 55%, about 24% on the best case and 21% on the worst, more optimistic than the evidence.
| Measure | At $9.82 | Formula |
|---|---|---|
| Expected return (header chip) | −19.7% | (10% × $16.90 + 55% × $9.26 + 35% × $3.15) ÷ $9.82 − 1 = ($1.69 + $5.09 + $1.10) ÷ $9.82 − 1 |
| Gain to loss (header chip) | 0.27 to 1 | (10% × $7.08) ÷ (55% × $0.56 + 35% × $6.67) = $0.71 ÷ ($0.31 + $2.33) |
| Best gain ÷ worst loss | 1.06 to 1 | $7.08 ÷ $6.67 |
Both header chips take the color of the rating band the price is in: BUY green (an expected return of +25% or more with gain to loss of 3 to 1 or better), ACCUMULATE blue (+10% to +25%), HOLD gold (−10% to +10%), TRIM orange (−25% to −10%) and SELL red (below −25%). On the best guess they are green below $5.94 (where gain to loss reaches 3 to 1; the expected return reaches +25% higher, at $6.31), blue up to $7.17, gold up to $8.76, orange up to $10.51 and red above. At $9.82 both are orange, the TRIM band; the header rounds gain to loss down to one decimal, 0.2 to 1 for 0.27.
| Volatility, annualized | Last 20 sessions | Last 60 sessions | Since the spin |
|---|---|---|---|
| To November 13, 2026 | 254% | 150% | 145% |
At the last 60 sessions' volatility, one standard deviation over a month is about ±54%, or $6.55 to $15.54 from the $10.09 close; about two months in three end inside that range if volatility holds. The median daily move since the spin is 2.4%.
| Results day | Released | Close before | Close after | Move | Times a median day |
|---|---|---|---|---|---|
| August 13, 2026 | Before the open | $25.24 | $25.82 | +2.3% | 1.0× |
| November 12, 2026 | Before the open | $19.58 | $9.82 | -49.8% | 21.2× |
Average move on a results day: 26.1% either way, against a median day's 2.4%. The move is measured from the close before the release to the close of the first session after it.
The debt and the covenants
| Covenant | Limit | Now | Room | Protects |
|---|---|---|---|---|
| Total net leverage (net debt over EBITDA as the agreement defines it) | 4.75× at first; 4.50× from the third fiscal quarter after the spin, 4.25× from the fifth, 4.00× from the seventh, 3.50× from the ninth (about the third quarter of 2028); a one-time step-up to 4.00× after an acquisition of $250M or more | ~3.4× (an estimate: $792M net debt at October 3, 2026 over 2026 guided adjusted standalone EBITDA of $230–240M); in compliance at the first test, October 3, 2026 (10-Q) | Base case about 3.2× at the end of 2027 against 4.25×, and 2.8× in 2028 against 3.50×; the worst case reaches about 3.5× at the end of 2028, at the final limit (estimates, before the agreement’s add-backs) | Revolving credit only (a maintenance test for the revolver lenders) |
| Interest coverage (EBITDA over interest) | At least 2.50× | ~3.1× (an estimate: guided EBITDA of about $235M over about $76M of interest a year) | EBITDA could fall about 20% before 2.50× | Revolving credit only |
| Dividends and buybacks | Restricted by the credit agreement and the indenture; the preferred participates in any common dividend | None paid or authorized | — | Credit agreement, indenture |
| Change of control | Notes: offer to repurchase at 101%. Bank debt: an event of default. Preferred: ADI may buy it out at 150% of the accumulated amount | — | — | Notes; bank debt; preferred |
| Mergers and buybacks (tax matters agreement with Resideo, not the debt) | For two years from the spin, to about August 3, 2028: restrictions on mergers, sales of the business, stock redemptions and issuing stock or convertibles | No buyback authorized | Restrictions end about August 3, 2028 | Shares and M&A |
The covenant definition of EBITDA usually adds back restructuring and expected cost savings, so the reported ratio may be lower than these estimates. No credit ratings are disclosed in the filings.
- The debt is unchanged: a $600 million term loan due 2033 at SOFR plus 2.75% and $400 million of 7.125% notes due 2034, about $76 million of interest a year. ADI was in compliance at the first covenant test, October 3, 2026.
- The revolver’s leverage limit steps down from 4.75 times now to 4.50 times in early 2027, 4.25 times in the second half of 2027, 4.00 times in early 2028 and 3.50 times from about the third quarter of 2028. On the guided EBITDA, net leverage is about 3.4 times today. The path, before the add-backs the agreement allows (estimates):
| Year end | Base case: net debt / EBITDA | Net leverage | Limit at the time | Worst case: net debt / EBITDA | Net leverage |
|---|---|---|---|---|---|
| 2026 | $783M / $235M | 3.3× | 4.75× | $783M / $230M | 3.4× |
| 2027 | $747M / $233M | 3.2× | 4.25× | $745M / $206M | 3.6× |
| 2028 | $698M / $251M | 2.8× | 3.50× (from about Q3) | $711M / $203M | 3.5× |
Net debt falls by levered free cash flow from the model (the preferred dividend accrues in kind); EBITDA is the company’s adjusted standalone figure. The agreement’s own EBITDA adds back restructuring and expected savings, so its ratio is likely lower.
- The covenant binds only in the worst case, and only in late 2028. It is a test for the revolver lenders, and the revolver is undrawn; the main risk from a breach is losing the revolver as a cash cushion in a downturn. Interest cover is about 3.1 times against a minimum of 2.50 times.
Notes on earlier sections
- The cases are rebuilt, the method is not. The October 23, 2026 cases ($27.24 / $18.02 / $9.13) assumed 2026 within the old guidance and margins recovering toward the 2023–2025 record; the guidance cut and the call’s 2027 outlook replace those paths. A business change.
- Covenant estimates. The October 23, 2026 debt table put net leverage at about 2.8–3.0 times on the old guidance and said EBITDA could fall about 35% before the first limit; on the cut guidance it is about 3.4 times. The debt table has been updated. A business change.
- The rating scale changed on October 29, 2026. The October 23, 2026 bands above used the earlier definitions, including REDUCE; the current scale uses TRIM and SELL.
The rating and what to watch
HOLD → TRIM, target $16 → $8. The target is the best-guess value, $7.89. At $9.82 the expected return is −19.7%, inside the TRIM band of −10% to −25%, and gain to loss is 0.27 to 1: the base case sits 6% below the price and the worst case 68% below it. It is TRIM rather than SELL because the base case is close to the price, the revolver is undrawn with $708 million of liquidity, and the price already fell by half in a day; it becomes SELL above $10.51. It is not HOLD because management’s own 2027 planning offers no margin recovery and the price still implies better odds than the evidence; it becomes HOLD below $8.76.
| Action | Level | Reason |
|---|---|---|
| Buy | Below about $5.94 | Expected return 25% or more with gain to loss of 3 to 1 or better |
| Accumulate | $5.94–7.17 | Expected return 10% or more |
| Hold | $7.17–8.76 | Expected return −10% to +10%, around the $8 target |
| Trim | $8.76–10.51 | Expected return −10% to −25% |
| Sell | Above about $10.51 | Expected return below −25% |
| Move the bands up | Exclusive Brands back to growth, 2027 guidance with EBITDA growth and a margin above 5%, or the cost program ahead of schedule | The best case’s weight rises |
| Move the bands down | A further guidance cut, a revolver draw, a covenant amendment, or another impairment | The worst case’s weight rises |
What the fourth-quarter results and the 2027 guidance (about February 2027, date not announced) must show:
| Item | Why it matters | The base case needs |
|---|---|---|
| Fourth-quarter EBITDA | Guided to $28–38 million, about 3% of revenue | Within the range |
| 2027 guidance | The first look at a full standalone year | EBITDA about flat on 2026, about $230–240 million |
| Exclusive Brands | Down high single digits in October 2026 | The decline narrowing to low single digits |
| Gross margin | 20.0% without one-time items | Holding near 20% |
| Cost program | $60 million annualized by the end of 2026 | Delivered, with the extra reductions sized |
| Net leverage and the revolver | About 3.4 times; the limit steps to 4.50 times in early 2027 | Net debt falling, revolver undrawn |
Update — October 23, 2026: the scenarios, the money, the debt and who is trading — HOLD, target $18 → $16
Written against the October 22, 2026 close of $16.48. Sources: the information statement, the credit agreement, the separation 8-K, the second-quarter 2026 10-Q, ADI’s Schedule 13G, Form 3, Form 4 and Form 144 filings since the spin, FINRA short interest, S&P Dow Jones Indices' July 31, 2026 index notice, funds’ holdings filings, and a summary of the CEO’s September 10, 2026 Jefferies conference remarks. Peer prices are Yahoo closes; ADI’s prices and volumes are from this site’s own archive. The September 29 analysis below is left as published. This section turns its valuation into three scenarios with weights, and adds stress tests, the money, the debt, who has been trading, short interest and volatility. No results have been reported since September 29; the third quarter is due on November 12.
The one-line version
ADI is priced close to what it is worth on the evidence so far: about $16 a share, against $16.48. Weighted 10% best, 55% base and 35% worst, the scenarios are worth $15.83, an expected return of −4%, with 75 cents of probability-weighted gain for each dollar of loss. The price implies about the same weights (14 / 55 / 31).
The weights lean to the downside because management does. On September 10 the CEO said residential AV, more than a quarter of revenue, will be flat to slightly down and that margin gains will come mostly in 2028–30, while the second quarter’s volume fell 2.4% and short interest rose to 4.8% of the shares.
The swing factor is the margin. A 2027 recession takes the value to about $13.60; a margin that stalls at 5.0%, to about $14. The debt holds for the next several years: the covenants pass even in the recession case. But in the worst case about $0.34 billion of the notes due in 2034 would need refinancing.
Since September 29 the stock fell 11% while distributors and security makers rose 5%. That is company news, not the sector: a cautious initiation, a target cut to $20, and steady selling by Resideo’s former chief executive. One clarification: CD&R’s 7.48 million common shares are the information statement’s projection; no ADI filing shows them yet.
What happened since September 29
| Date | What happened | Stock that day | Read |
|---|---|---|---|
| Sep 10 | CEO Robert Aarnes at the Jefferies industrials conference: residential AV “flat to slightly negative” with “no clear sign of a residential recovery”; about 80 basis points of gross-margin headwind from tariffs in 2026, before the refund; margin gains “non-linear”, mostly in 2028–30; leverage from about 3× toward 2× | +3.6% | Not in the September 29 analysis. It is management’s own description of a slow recovery, and the main evidence for the weights below |
| Sep 28 | Evercore ISI starts coverage at In Line, target $23 (report): margin benefits “in 2028 and beyond” | −5.2% | The fifth broker; its case matches the September base case |
| Sep 30 | Quarter end; 2.0 million shares traded, three times normal | −5.7% | No company news found; the largest volume since August 14, the day after results |
| Oct 1 | Resideo’s former chief executive, Jay Geldmacher, sells 25,000 shares (Form 144) | +0.3% | Part of 353,287 shares sold since August 14; see below |
| Oct 8 | Dimensional reports 5.1% (Schedule 13G, at September 30) | −1.9% | Unchanged from its implied day-one position |
| Oct 13 | J.P. Morgan cuts its target to $20 from $25, Neutral (report); Geldmacher’s 40,000-share sale of October 12 is filed | −2.6% | It cut Resideo to $20 the same day |
| Oct 14 | No news found | −6.1% | On ordinary volume (709,000 shares): buyers stepping back; no block trade was reported |
| Oct 19 | Closing low since the spin, $15.22 | −1.7% | |
| Oct 22 | Third-quarter results set for November 12, before the open | −0.4% |
How the money moves
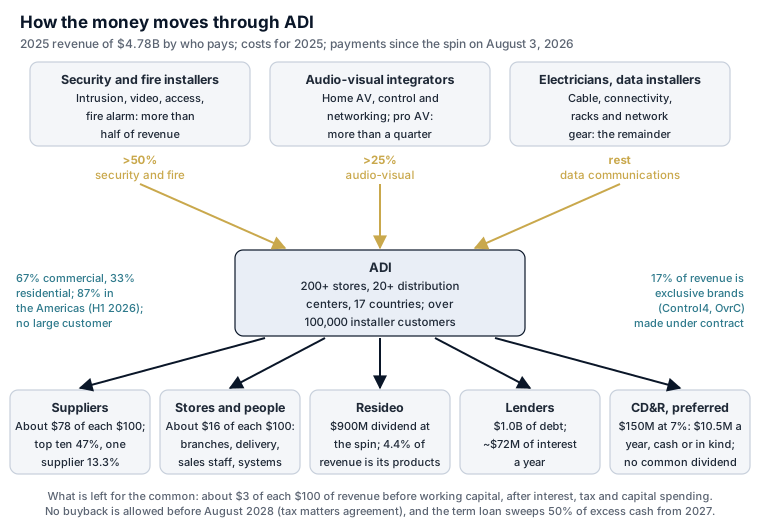
Who pays:
- Professional installers, more than 100,000 of them. No customer is large enough to be disclosed. More than half of revenue is security and fire, more than a quarter audio-visual, and the rest data communications.
- 67% of product sales end up in commercial buildings and 33% in homes; the Americas were 87% of first-half 2026 revenue.
- Exclusive brands are about 17% of revenue, mostly Snap One’s residential AV line (Control4, OvrC), which the CEO said carries about three times the margin of the base business. That is why residential AV’s weakness matters more than its share of revenue.
- The suppliers are concentrated: the ten largest were 47% of 2025 revenue and one alone 13.3%, on non-exclusive agreements of about three years.
Where each $100 of revenue went, 2025, as if standalone (2025 carve-out results with standalone interest). Suppliers take about $78 of each $100; ADI’s gross margin of about 22% is what pays for the stores, the trucks and the people. The 2025 working-capital step is unusually large: inventory grew $119M, much of it bought ahead of tariffs, so 2025 free cash flow on this basis was close to nothing. The Investor Day target of over $1 billion of operating cash flow by 2030 implies about $4 of each $100 of revenue every year. Source: the information statement (combined statements of operations and cash flows; pro forma interest); per-$100 figures are calculations.
About $3 of each $100 of revenue is left after interest, tax and capital spending, before working capital (an estimate for 2025 as a standalone company). In 2025 working capital took almost exactly that, because inventory grew $119 million, much of it bought ahead of tariffs. A distributor’s cash flow swings with its inventory: it consumes cash when sales grow and releases it when they fall, which is why the recession case below produces more cash in its first year.
The debt, tranche by tranche
All $1.0 billion was raised for the spin, and $900 million of it went to Resideo. ADI kept about $150 million of cash; the revolver was undrawn at the spin and on August 13.
| Tranche | Amount ($M) | Rate | Matures | Repaying early | Security | Notes |
|---|---|---|---|---|---|---|
| Term loan | 600 | SOFR + 2.75% (or base rate + 1.75%) | About August 2033 (seven years) | At par; 1% premium on a repricing within six months of the spin | Senior secured, first lien on substantially all U.S. assets | 0.25% of $600M a quarter; 50% of excess cash flow from fiscal 2027, stepping down to 25% and 0% as leverage falls |
| 7.125% senior notes | 400 | 7.125% fixed, paid January and July from January 15, 2027 | July 15, 2034 | Make-whole to July 15, 2029, then the indenture’s call schedule; up to 40% from equity offerings before then | Senior unsecured; guaranteed by the credit-facility guarantors | 101% repurchase offer on a change of control |
| Total drawn | 1,000 | ~7.2% cash in 2027 (notes fixed at 7.125%; term loan floating at SOFR + 2.75%, about 7.15% on the site’s SOFR path); the information statement’s pro forma used 6.78% | ||||
| Revolving credit | $500M | SOFR + 1.50–2.00%, 0.25–0.35% on the unused amount, by net leverage | About August 2031 (five years) | Senior secured, with the term loan | Undrawn at the spin and at August 13, 2026 |
All $1.0 billion was raised for the spin: $900 million was paid to Resideo as a dividend and ADI kept about $150 million of cash. The revolver was undrawn at the spin and on August 13. No interest-rate hedges are disclosed. The $150 million 7% convertible preferred held by CD&R is equity, not debt, but ranks ahead of the common. Source: the information statement, the credit agreement, the separation 8-K and the second-quarter 2026 10-Q. As of August 3, 2026.
Principal due by year, including scheduled amortization. Nothing beyond 1% a year of term-loan amortization is due before the revolver’s 2031 maturity; the term loan’s balloon is in 2033 and the notes in 2034.
In the base case ADI can repay both maturities from its own cash, with almost nothing to spare; in the worst case the 2034 notes need refinancing. Comparing the cash available with the debt due (estimates):
| Base case | Worst case | |
|---|---|---|
| Free cash flow, August 2026–December 2033 | ~$0.79B | ~$0.47B |
| Cash at the spin | + ~$0.15B | + ~$0.15B |
| Term-loan amortization, 1% a year | − ~$0.05B | − ~$0.05B |
| Available by the term loan’s maturity | = ~$0.90B | = ~$0.58B |
| Term loan due about August 2033 | − ~$0.56B | − ~$0.56B |
| Free cash flow, January–July 2034 | + ~$0.07B | + ~$0.04B |
| 7.125% notes due July 2034 | − $0.40B | − $0.40B |
| Cash left after repaying both | = ~$0.02B | = − ~$0.34B (short) |
The term loan also takes half of each year’s excess cash flow from 2027, so in practice it will be repaid earlier and the interest bill will fall faster than shown below. No dividend or buyback is assumed; the tax matters agreement rules out buybacks until about August 2028 in any case.
Interest expense, 2026–2031
Six-tenths of the debt floats. The $600 million term loan pays SOFR plus 2.75% and is not hedged; the $400 million of notes pay 7.125%. On the SOFR path priced in fed funds futures on October 9, 2026, as on the site’s other profiles (all figures estimates, $ millions):
| $ millions | 2026* | 2027 | 2028 | 2029 | 2030 | 2031 |
|---|---|---|---|---|---|---|
| SOFR, yearly average | ~3.75% | ~4.40% | ~4.65% | ~4.65% | ~4.65% | ~4.65% |
| Term loan (SOFR + 2.75%) | $16 | $42 | $43 | $43 | $43 | $42 |
| 7.125% notes, 2034 | + $12 | + $29 | + $29 | + $29 | + $29 | + $29 |
| Revolver fee | + $1 | + $2 | + $2 | + $2 | + $2 | + $2 |
| Issuance costs written off (non-cash) | + $1 | + $3 | + $3 | + $3 | + $3 | + $3 |
| Interest expense | = ~$30 | = ~$75 | = ~$76 | = ~$76 | = ~$76 | = ~$75 |
*2026 from the August 3 spin. No excess-cash-flow repayment is assumed; issuance costs are not disclosed and are an estimate. Source: model in the site’s analysis files.
Each point of SOFR costs about $6 million a year, about $0.05 a share after tax; one point lower saves about the same.
| Covenant | Limit | Now | Room | Protects |
|---|---|---|---|---|
| Total net leverage (net debt over EBITDA as the agreement defines it) | 4.75× at first; 4.50× from the third fiscal quarter after the spin, 4.25× from the fifth, 4.00× from the seventh, 3.50× from the ninth (about the third quarter of 2028); a one-time step-up to 4.00× after an acquisition of $250M or more | ~3.4× (an estimate: $792M net debt at October 3, 2026 over 2026 guided adjusted standalone EBITDA of $230–240M); in compliance at the first test, October 3, 2026 (10-Q) | Base case about 3.2× at the end of 2027 against 4.25×, and 2.8× in 2028 against 3.50×; the worst case reaches about 3.5× at the end of 2028, at the final limit (estimates, before the agreement’s add-backs) | Revolving credit only (a maintenance test for the revolver lenders) |
| Interest coverage (EBITDA over interest) | At least 2.50× | ~3.1× (an estimate: guided EBITDA of about $235M over about $76M of interest a year) | EBITDA could fall about 20% before 2.50× | Revolving credit only |
| Dividends and buybacks | Restricted by the credit agreement and the indenture; the preferred participates in any common dividend | None paid or authorized | — | Credit agreement, indenture |
| Change of control | Notes: offer to repurchase at 101%. Bank debt: an event of default. Preferred: ADI may buy it out at 150% of the accumulated amount | — | — | Notes; bank debt; preferred |
| Mergers and buybacks (tax matters agreement with Resideo, not the debt) | For two years from the spin, to about August 3, 2028: restrictions on mergers, sales of the business, stock redemptions and issuing stock or convertibles | No buyback authorized | Restrictions end about August 3, 2028 | Shares and M&A |
The covenant definition of EBITDA usually adds back restructuring and expected cost savings, so the reported ratio may be lower than these estimates. No credit ratings are disclosed in the filings.
The covenants have room even in a recession, but the room narrows as the limit steps down. Net leverage is about 2.8–3.0 times today against 4.75 times, falling to a 3.50 times limit by about the third quarter of 2028. In a 2027 recession (revenue −8%, margin 1.2 points lower), leverage peaks at about 3.3 times against that year’s 4.25 times limit, and interest coverage falls to about 2.8 times against the 2.50 minimum, the closer of the two tests. In the worst case leverage drifts down slowly, to about 2.7 times in 2028.
Where ADI is
ADI’s network is built for same-day pickup by installers. At April 4, 2026 it had 247 sites: 22 distribution centers, 198 stores and 27 offices and other sites, 194 of them in the Americas, 50 in Europe and 3 in Australia. The filings name almost none, and ADI’s online store locator could not be read, so the 226 sites below come from supplier stockist lists, Snap One event listings, acquisition notices, job postings and ADI’s Czech website. Most are placed at the city centre, and 64 are shown as unconfirmed because the only source is older.
247 sites at April 4, 2026: 22 distribution centers, 198 stores and 27 offices and other sites; 194 in the Americas, 50 in Europe and 3 in Asia-Pacific (Australia). The map shows the 226 sites that could be identified; ADI does not publish its list. Most points are placed at the city centre. Click a point for details. Map data © OpenStreetMap contributors. Source: the information statement (site counts by region), Resideo’s 2025 10-K (segment properties) and, for individual sites, supplier stockist lists, Snap One event listings, acquisition notices, job postings and ADI’s Czech website; six sites geocoded with OpenStreetMap, the rest placed at the city centre. As of October 23, 2026.
The Americas were 87% of first-half 2026 revenue. Stores sit near installers in every large metro area; the largest distribution centers identified are Fort Worth, Texas (over 400,000 sq ft, opened 2023) and Feura Bush, New York (about 135,000 sq ft). Canada and Puerto Rico are served from local stores; the Mexico sites found are support offices. Click a point for details. Map data © OpenStreetMap contributors. Source: the information statement (site counts by region), Resideo’s 2025 10-K (segment properties) and, for individual sites, supplier stockist lists, Snap One event listings, acquisition notices, job postings and ADI’s Czech website; six sites geocoded with OpenStreetMap, the rest placed at the city centre. As of October 23, 2026.
Europe was about 11% of 2025 revenue ($538M): a store network across the United Kingdom and Ireland served from a hub in Oldham, and stores in the Czech Republic, Slovakia and Poland, with offices in Düsseldorf and a Snap One engineering site in Belgrade. ADI has left South Africa (2023) and appears to have left most of Scandinavia and southern Europe. Click a point for details. Map data © OpenStreetMap contributors. Source: the information statement (site counts by region), Resideo’s 2025 10-K (segment properties) and, for individual sites, supplier stockist lists, Snap One event listings, acquisition notices, job postings and ADI’s Czech website; six sites geocoded with OpenStreetMap, the rest placed at the city centre. As of October 23, 2026.
- The United States is 81% of revenue ($3,883 million of $4,784 million in 2025), served from stores in every large metro area and from regional distribution centers; the largest identified are in Fort Worth, Texas, and Feura Bush, New York.
- Europe is 11% ($538 million): the United Kingdom and Ireland from a hub in Oldham, plus the Czech Republic, Slovakia and Poland. ADI left South Africa in 2023 and appears to have left most of Scandinavia and southern Europe, where Snap One’s products now go through other distributors.
- Most sites are leased (lease obligations of $236 million), which lets the store consolidation in the $80 million cost program move as leases come up.
- About 4,100 people work for ADI, 2,681 of them in the United States.
The scenarios and the asymmetry
The cases. Each is valued on the September 29 method (40% discounted cash flow, 30% an earnings multiple on 2027, 30% an EBITDA multiple on underlying 2026), and the base case reproduces the published $18 target exactly before anything changes. In the September analysis the multiples were set for a business that recovers its margin; a case in which it does not, or in which the plan is delivered, would not carry the same multiples, so they move with the case (a judgement; with the September multiples throughout the cases are $24.21, $18.02 and $11.42).
| Case | What it assumes | Value | vs $16.48 |
|---|---|---|---|
| Best | Management’s 2030 plan: revenue up 5% a year to about $6.1 billion, adjusted EBITDA above 8% (about 7.5% with stock compensation charged); 2026 at the top of the guidance; 13 times earnings, 12 times EBITDA | $27.24 | +65% |
| Base | The September 29 base case: revenue up 3% a year, the 2023–25 margin recovered plus a quarter of the $80 million cost program (6.0%) by 2030; mid-guidance; 11 times and 10 times | $18.02 | +9% |
| Worst | The decline continues: revenue up 1% a year, as volume falls and price holds it up, and the margin drifts to 4.5% as in 2024’s price cuts; the low end of the guidance; 9 times and 8 times, about where the stock traded in September | $9.13 | −45% |
Stress tests, one change at a time on the base case (estimates):
| Change | Value | vs $16.48 |
|---|---|---|
| A 2027 recession: revenue −8%, margin 1.2 points lower, back on the base path by 2029 | $13.59 | −18% |
| Between base and worst: the margin stalls at 5.0%, at 9.5 times and 9 times | $13.99 | −15% |
| The margin recovers only halfway, to 5.0% | $15.66 | −5% |
| The discount rate at 10.5% instead of 9.5% | $16.66 | +1% |
| No growth, 2027–31 | $16.79 | +2% |
| The 2023–25 margin recovered, none of the cost program kept (5.6%) | $17.08 | +4% |
| Working capital at 30% of each dollar of growth instead of 20% | $17.10 | +4% |
| The preferred dividend paid in kind for two years (1.35 million more shares as converted) | $17.74 | +8% |
| Between base and best: half the plan (4% growth, a 6.75% margin), at 12 times and 11 times | $21.76 | +32% |
The largest single risk is the margin, through a recession or a stall; growth and the discount rate move the value by about a dollar each.
Three weightings, and what the price implies. The standard set, 25 / 50 / 25, and the stress set, 10 / 40 / 50, are the same for every company; the best guess drives the target and the two chips at the top of the page.
| Weights, best / base / worst | Value | Expected return | Gain to loss |
|---|---|---|---|
| Standard: 25 / 50 / 25 | $18.10 | +10% | 1.9 to 1 |
| Best guess: 10 / 55 / 35 | $15.83 | −4% | 0.75 to 1 |
| Stress: 10 / 40 / 50 | $14.50 | −12% | 0.46 to 1 |
| What the price implies: 14 / 55 / 31 | $16.48 | 0% | 1.0 to 1 |
The weights are a judgement. All values are estimates from the model.
Why the best guess leans toward the downside:
- The best case is unlikely, about 10%. It needs revenue growth of 5% a year, a gross-margin gain and most of the $80 million program kept, all at once, from a business whose margin peaked in 2022 and whose organic growth since then has been about 2% a year. Management itself expects residential AV, its highest-margin product line, to be flat to slightly down through 2028, and the margin gains to come mostly in 2028–30.
- The worst case gets 35%. It needs nothing new to happen, only for the pattern of the last year to continue: volume fell 2.4% in the second quarter, price cuts were needed in 2024, and the 2026 margin is already below the 2023–25 level. Two of five brokers have moved toward this view since September 29, short interest has risen for four reports in a row to 4.8% of the shares, and ten-year Treasury yields above 5% weigh on the housing market residential AV depends on.
- The base case takes 55%: part of the 2026 decline is tariff timing that should reverse, the cost program is under way, the covenants hold in every case, and the market leader in a fragmented distribution business has kept its share.
- Evidence that would move the weights at the November 12 results: volume back to growth, a gross margin that absorbs the tariff headwind, and the guidance held (worst case down); another volume decline, a guidance cut, or a revolver draw (worst case up).
What the price implies. Holding the base case at its 55% weight, the price solves
best weight × $27.24 + 55% × $18.02 + (45% − best weight) × $9.13 = $16.48
for a best weight of ($16.48 − 55% × $18.02 − 45% × $9.13) ÷ ($27.24 − $9.13) = 14%, leaving 31% on the worst case. The market’s weights are within a few points of the best guess, which is what fair value looks like.
The asymmetry on the best guess:
| Measure | At $16.48 | What it means |
|---|---|---|
| Expected return (header chip) | −4% | The probability-weighted value, $15.83, against the price |
| Gain to loss (header chip) | 0.75 to 1 | +$1.92 of probability-weighted gain against −$2.57 of loss |
| Expected base-case gain ÷ expected worst-case loss | 0.33 to 1 | +$0.85 against −$2.57: the likely outcome does not pay for the bad one |
| Best-case gain ÷ worst-case loss | 1.5 to 1 | +$10.76 against −$7.35 |
| Base-case gain ÷ worst-case loss | 0.21 to 1 | +$1.54 against −$7.35 |
How the measures are calculated. Gain = case value − price; loss = price − case value. Weights are the best guess: 10% best, 55% base, 35% worst.
| Measure | Formula | At $16.48 |
|---|---|---|
| Expected return | (10% × best + 55% × base + 35% × worst) ÷ price − 1 | ($2.72 + $9.91 + $3.20) ÷ $16.48 − 1 = −4% |
| Gain to loss | (10% × best gain + 55% × base gain) ÷ (35% × worst loss) | ($1.08 + $0.85) ÷ $2.57 = 0.75 (unrounded $1.92 ÷ $2.57) |
| Expected base ÷ expected worst | (55% × base gain) ÷ (35% × worst loss) | $0.85 ÷ $2.57 = 0.33 |
| Best ÷ worst | best gain ÷ worst loss | $10.76 ÷ $7.35 = 1.5 |
| Base ÷ worst | base gain ÷ worst loss | $1.54 ÷ $7.35 = 0.21 |
| Price-implied best weight, base at 55% | (price − 55% × base − 45% × worst) ÷ (best − worst) | ($16.48 − $9.91 − $4.11) ÷ $18.11 = 14% |
The header chips are green at +25% or more and 3 to 1 or better, blue at +10–25% and 2–3 to 1, orange at 0–10% and 1–2 to 1, and red below zero and below 1 to 1. On the best guess, expected return is green below $12.67, blue up to $14.39 and orange up to $15.83; gain to loss is green below $13.07, blue up to $14.10 and orange up to $15.83. Both are red above $15.83, and so both are red at $16.48.
Who has been trading ADI
Since September 29 ADI fell 11.1% while its peers rose. Rebased to the September 28 close:
Closing prices rebased to September 28 = 100. Baskets are equal-weighted: distributors (ScanSource, Wesco, Core & Main, Pool, SiteOne, Watsco); security product makers (Allegion, Motorola Solutions, Johnson Controls); Resideo, the former parent; Russell 2000 and S&P 500 through their ETFs (IWM, SPY). Source: Yahoo Finance closes.
| From the close of | ADI | Distributors | Security makers | Resideo | Russell 2000 | S&P 500 |
|---|---|---|---|---|---|---|
| August 4 (day one) to August 14 | −3.5% | −4.5% | +1.7% | −21.7% | +1.1% | +0.6% |
| August 14 to September 28 | −12.8% | −3.7% | −4.0% | −11.1% | −8.2% | −1.4% |
| September 28 to October 22 | −11.1% | +5.2% | +5.1% | −2.4% | −1.2% | −0.2% |
| August 4 to October 22 | −25.1% | −4.0% | +2.6% | −32.0% | −8.3% | −1.0% |
Equal-weighted baskets: distributors are ScanSource, Wesco, Core & Main, Pool, SiteOne and Watsco; security makers Allegion, Motorola Solutions and Johnson Controls. Yahoo closes.
Until late September ADI fell with Resideo and small stocks; since then it has fallen alone. Its daily moves have almost no correlation with any of these groups yet (between −0.17 and 0.08 since the spin), as usual for a stock in its first months. Pool and Allegion rose sharply on their own results on October 22, which flatters the baskets for that day, but the gap was already about 13 points on October 21.
Daily volume (bars) and cumulative volume as a share of the 75.92 million shares outstanding (line). Gold bars mark days with a notable event; hover over one to see what happened. Source: this site's daily price archive (Yahoo Finance), through Oct 22, 2026.
70% of the shares have changed hands in 57 sessions, and the pace has slowed. Since September 28, 14.5% of the shares traded, at a median of about 555,000 shares a day, below the 636,000 median since the first month. The October fall came on ordinary volume, the pattern of buyers stepping back; a large holder selling would show as heavy days.
No index forced a trade. S&P Dow Jones Indices put ADI into the S&P SmallCap 600 before the open on August 4, in Resideo’s index, so funds tracking it received ADI shares in the distribution and kept them; S&P classes ADI as Information Technology. ADI was not part of the September rebalance. Funds’ filings show ADI in MSCI’s small-cap indexes from the spin as well.
Who holds it. Day-one positions are Resideo holdings at June 30, 2026, divided by two:
| Holder | Implied at the spin | Reported since | Change |
|---|---|---|---|
| BlackRock | 10.82M (14.3%) | 10.25M, 13.5% at August 31 (13G) | −0.57M |
| Fidelity (FMR) | 5.83M (7.7%) | 8.03M, 10.6% at August 31 (13G) | +2.20M |
| Vanguard | 7.49M (9.9%) | Not yet reported; a 13G would be due by about November 14 if above 5% | — |
| CD&R | 7.50M common (9.9%) plus the preferred | Preferred only: 9.26M shares as converted (Form 3, August 3) | See the note below |
| Dimensional | 3.92M (5.2%) | 3.90M, 5.1% at September 30 (13G) | Unchanged |
Implied positions are estimates and ignore trading between June 30 and the July 20 record date. The third-quarter 13F filings, which will show the register at September 30, arrive by about November 14.
- Fidelity bought about 2.2 million shares in the first four weeks, the largest buyer on the record.
- No officer or director has bought or sold on the open market. The only Forms 4 are award grants and shares withheld for tax on vesting awards.
- The one steady seller on the record is Resideo’s former chief executive, Jay Geldmacher, who is not an ADI insider and so files only notices of sale (Form 144, through Morgan Stanley): 353,287 shares in ten sales from August 14 to October 12, about $7.5 million, at an average of about $21.40, with no trading plan named. That is about 0.5% of the shares, small against daily volume but a steady supply into a falling market.
- Five brokers cover the stock, with targets from $20 to $35: Oppenheimer Outperform $30 (August 4), Seaport Buy $35 (August 14), Truist Hold $24 (August 26), Evercore ISI In Line $23 (September 28) and J.P. Morgan Neutral, cut to $20 from $25 (October 13). The two most recent are the most cautious.
Index membership, now and next
| Index family | Member? | Evidence |
|---|---|---|
| S&P SmallCap 600 and its growth and value indexes | Yes | S&P Dow Jones Indices, July 31, 2026; State Street’s S&P 600 funds hold it (641,954 shares in SPSM at October 22) |
| S&P MidCap 400, S&P 500 | No | Far below the size range |
| MSCI USA Small Cap and World Small Cap | Yes | Funds’ holdings filings at August 31, 2026 |
| Russell 2000 | Probably | Spinoffs take their parent’s Russell indexes; Resideo is in the Russell 2000. No public notice found |
| FTSE, CRSP | Probably | Both normally add a spinoff to its parent’s indexes; no holdings evidence found |
| Possible move | Rule | ADI now | Price that meets it | Next dates | Likelihood (judgement) |
|---|---|---|---|---|---|
| Up to the Russell 1000 | Rank above the ~$5.7 billion breakpoint (June 2026), with banding | ~$1.25B | ~$75 | Rank day October 30; preliminary lists November 13; effective after the close December 11, 2026 | Very low |
| Out of the S&P 600 | No size floor for members; additions need $1.2 billion | ~$1.25B | Only a much lower price would matter (judgement: below about $5) | Quarterly; next announced about December 4, effective about December 21 | Low |
| Up to the S&P MidCap 400 | $8.0 billion for additions (July 2025 range) | ~$1.25B | ~$105 | Quarterly | Very low |
| MSCI small cap to standard | The standard cutoff, well above ADI | Small cap | — | November review, effective about November 30 | Very low |
No index event is likely to force trading in the next three months. The December rebalances may shift ADI between the growth and value halves of the small-cap indexes, which trades small amounts between funds without changing the total.
Short interest and volatility
The tables below show how much of the stock is sold short and how much the price moves. They are inputs to the weights above, and the tables update with the nightly data.
| Report | Settled | Short | % float | % outst. | Days to cover |
|---|---|---|---|---|---|
| First after the spin | Aug 14, 2026 | 2.37M | 3.1% | 3.1% | 1.4 |
| Latest | Oct 30, 2026 | 3.72M | 4.9% | 4.9% | 8.7 |
The latest share of float is higher than 5 of the 5 earlier reports since the spin. Short interest in shares, with its share of the float and of shares outstanding. FINRA settlement dates; figures are published about eight business days later. Days to cover is short interest divided by average daily volume, as reported by FINRA. Float and shares outstanding on or before each date, from this site's daily share records and the company's filings.
Short interest has risen at every report since the spin, from 2.4 million shares (3.1%) on August 14 to 3.7 million (4.8%) on September 30, or 4.3 days of average volume; the September 30 figure was barely above September 15’s, so the rise is slowing. Within six months of a spin part of it is hedging by holders of the parent, but Resideo’s own holders have little reason to hedge ADI now. Rising short interest with days to cover above four argues for a heavier worst case, and it is one reason the best guess gives it 35%. The October 15 figure is due about October 26.
| Volatility, annualized | Last 20 sessions | Last 60 sessions | Since the spin |
|---|---|---|---|
| To November 13, 2026 | 254% | 150% | 145% |
At the last 60 sessions' volatility, one standard deviation over a month is about ±54%, or $6.55 to $15.54 from the $10.09 close; about two months in three end inside that range if volatility holds. The median daily move since the spin is 2.4%.
| Results day | Released | Close before | Close after | Move | Times a median day |
|---|---|---|---|---|---|
| August 13, 2026 | Before the open | $25.24 | $25.82 | +2.3% | 1.0× |
| November 12, 2026 | Before the open | $19.58 | $9.82 | -49.8% | 21.2× |
Average move on a results day: 26.1% either way, against a median day's 2.4%. The move is measured from the close before the release to the close of the first session after it.
The one results day so far was followed by the stock’s worst session: +2.3% on August 13 and −17.7% the next day, once the guidance was digested. The November 12 results are the first quarter as a standalone company.
A note on an earlier section
Clarification on CD&R’s common shares. The September 29 analysis said CD&R holds 7.48 million common shares received in the distribution, locked up with the preferred until August 2028, and that the site’s float figure (99.9%) is therefore wrong. The figure is the information statement’s projection (14.96 million Resideo shares divided by two), and CD&R’s amended Schedule 13D on Resideo describes a lock-up covering all common it held after the spin. But no ADI filing yet shows the common shares: CD&R’s Form 3 of August 3 reports only the preferred, convertible into 9.26 million shares, and CD&R has filed no Schedule 13D on ADI, which a holder of about 19.6% as converted would normally file. A pro rata distribution is exempt from immediate reporting on Form 4, so the shares may simply not have been reported yet. Until a filing shows them, the float correction is unconfirmed. A clarification; no published figure changes.
What it means for the rating
HOLD, target $18 → $16. The target is the best-guess value, $15.83; the September 29 target was the base case, before any weights. At $16.48 the stock is 4% above the target and 9% below the base case, and both chips are red: there is no case for new money at this price, and no case for selling either, because the price already assumes about the same odds as the best guess. It is HOLD rather than REDUCE because the base case is above the price, the covenants hold even in a recession, and the next results could move the weights either way. It is not ACCUMULATE because the company’s own outlook for residential AV and the margin is slow, and the worst case is 45% below the price.
| Action | Level | Reason |
|---|---|---|
| Buy | Below about $12.70 | Both chips green: expected return above 25% and gain to loss above 3 to 1 |
| Accumulate | $12.70–14.40 | Expected return 10–25% |
| Hold | $14.40–18.00 | |
| Trim | Above about $18 | The base case |
| Move to REDUCE | Volume down again in the third quarter, a cut to the 2026 guidance, or a revolver draw | |
| Move to ACCUMULATE | Volume back to growth with the gross margin absorbing the tariff headwind, and the cost program on schedule |
What the November 12 results must show:
| Item | Why it matters | Base case needs |
|---|---|---|
| Volume, separate from price and currency | Q2’s −2.4% is the main reason the worst case carries 35% | Flat or better |
| Gross margin | Management’s 80 basis points of 2026 tariff headwind, against any further tariff refunds | Down no more than the headwind, refunds shown separately |
| The 2026 guidance ($4.95–5.00 billion revenue, $275–295 million standalone adjusted EBITDA) | It implies $139–159 million of EBITDA in the second half | Held |
| Residential AV and exclusive brands | The highest-margin line, guided flat to down | No worse than flat |
| Cash at September 30 and the revolver | The first standalone balance sheet | Undrawn revolver; free cash flow positive in the third quarter |
| The preferred dividend | Cash or in kind; in kind adds about 0.65 million shares a year | Either, stated |
| The $80 million cost program and store consolidations | The only route to the base-case margin | On schedule |
Post-Spin Analysis — September 29, 2026
Written against the September 28 close of $18.53. Primary sources: ADI’s information statement (dated July 20, 2026, filed as Exhibit 99.1 to the separation 8-K), the separation 8-K (August 4, 2026), the Form 10-Q for the quarter ended July 4, 2026 and the second-quarter results release (both August 13), the Investor Day release (July 14), Resideo’s second-quarter release and Resideo’s Form 10-Ks for 2019, 2021, 2023 and 2025, which report this business as the ADI Global Distribution segment back to 2017. Peer figures are computed from each peer’s own filings. Price, volume and cohort figures are from this site’s own daily archive.
The one-line version
ADI is the leading North American distributor of professionally installed security products, spun out carrying $1.0 billion of debt that paid for its former parent’s exit from a Honeywell liability, and its underlying earnings are falling faster than the headline shows.
The $900 million dividend ADI paid Resideo is the Honeywell bill, moved. In August 2025 Resideo paid Honeywell $1,590 million to end the environmental indemnity it had carried since its own 2018 spin, borrowing $1,225 million to do it, and announced this separation the same day. At the spin ADI borrowed $1.0 billion and sent $900 million plus a cash true-up to Resideo to repay debt. Net leverage is about 3.0× guided 2026 EBITDA, with a $150 million 7% convertible preferred held by CD&R ranking ahead of the common.
The guidance flatters the year. Second-quarter adjusted EBITDA of $86 million includes about $20 million of one-time tariff refunds. Without them it was about $66 million, −31% on the year, and volume fell 2.4%. The full-year guide of $275–295 million carries the same refund, so the underlying run rate is nearer $255–275 million — a margin of about 5.3%, against about 6.1% on the same standalone basis in 2025.
The longer record shows a peak already passed. On Resideo’s segment basis the business earned an 8.7% operating margin in 2022. The Form 10’s three years begin in 2023, after the peak, and organic growth since 2022 has averaged about 2% a year — the “5% organic since 2020” in the information statement starts from the pandemic trough.
The price already knows some of this. ADIG ran +28.5% in five sessions, gave it all back after the first results, and closed September 28 at a new low, −15.8% from day one, with 56% of the share count traded in 39 sessions. At about 8.5× guided EBITDA and 15× underlying 2026 earnings it is not expensive for a market leader, and not cheap for a 5% margin distributor with this balance sheet.
Rating: HOLD · Target $18 · Grade: B (2.73)
What the business actually is
One segment, four product categories, sold to installers. ADI buys from more than 1,000 manufacturers and resells over 500,000 products to more than 100,000 professional installers — security dealers, fire-alarm contractors, AV integrators and low-voltage electricians — through more than 200 stores, over 20 distribution centers in 17 countries, and a website and app that carry a growing share of orders. About 67% of product sales end up in commercial buildings and 33% in homes.
| Category | Share of 2025 revenue | What drives it |
|---|---|---|
| Security (intrusion, video, access control) and fire/life safety | >50% | Replacement cycles — cloud video, mobile credentials, alarm modernization — and building codes |
| Audio-visual — residential AV (control, lighting, networking) and professional AV (displays, conferencing) | >25% | New homes and remodels for residential; office and institutional fit-outs for pro AV |
| Data communications (cable, connectivity, racking, network equipment) | the remainder | Commercial construction and network upgrades |
Category shares are the information statement’s own “greater than” figures; ADI does not disclose exact percentages. The Americas were 87% of first-half 2026 revenue — $2,158 million of $2,492 million.
It is a distributor with a manufacturer inside it. About 17% of revenue — $424 million in the first half of 2026 — comes from exclusive brands: products ADI designs and has contract-manufactured, mostly in Asia. Most of them came with Snap One, bought by Resideo in June 2024 for about $1.4 billion, which brought the Control4 home-automation platform, the OvrC remote-management service and a line of residential AV and networking products. That is why ADI reports research and development expense ($39 million in 2025) — unusual for a distributor.
The supplier base is concentrated at the top. The ten largest suppliers were 47% of 2025 revenue; one supplier alone was 13.3%. None of the agreements is exclusive, and the average term is three years. Resideo’s own products were 4.4% of 2025 revenue, and a two-year commercial agreement signed at the spin gives ADI a semi-exclusive right to sell certain Resideo security products in the US and Canada, at a fixed price that protects its distribution margin, in return for minimum purchase commitments.
Management Team
The team that ran ADI inside Resideo, a CFO from Snap One, and a board built out of distribution.
| Officer | Role | Record |
|---|---|---|
| Robert Aarnes | President & Chief Executive Officer | Has run ADI since January 2017 — first under Honeywell, then as president of Resideo’s ADI segment from 2018. Joined Honeywell’s ADI in 2013 from Gunnar Optiks, where he was CEO. Naval Academy graduate. Director of MSC Industrial since 2024 |
| Michael Carlet | EVP & Chief Financial Officer | Resideo’s CFO from 2024, and before that Snap One’s CFO for ten years (2014–2024); CFO of Driven Brands 2002–2013 |
| Jeannine Lane | EVP & General Counsel | Resideo’s general counsel since 2018; Honeywell security and fire legal roles from 2004 |
| Alicia Copeland | EVP & Chief Operating Officer | At ADI since 2016; COO since March 2026 |
| Marco Cardazzi | EVP & Chief Merchandising Officer | At ADI since 2011; previously at Global Industrial and MSC Industrial |
| James Olender | EVP & Chief Information Officer | Joined May 2026 from GE Vernova’s Wind segment, where he was CIO; twenty years at GE including large separations |
Aarnes’s record is checkable, and it is the table in the next section. He has run this business for nine years. Revenue went from $2.5 billion to $4.8 billion, about $1 billion of it bought with Snap One. Margin peaked in 2022 and is lower today on every basis that separates the business from the acquisition.
The last year of that record was below the company’s own plan. ADI executives’ 2025 bonuses were partly tied to the segment’s results. The targets were $4,825 million of revenue and a 5.2% operating margin. ADI delivered $4,738 million and 4.5%, and the segment portion paid out at 72% of target. Both misses were modest, but a bonus plan that measures margin as a percentage of revenue is a plan the business did not meet in its last full year.
The board
Eight directors, and the distribution experience is real:
- Michael Kaufmann (chair) — CEO of Cardinal Health 2018–2022 and its CFO before that
- Stephen LeClair — CEO of Core & Main 2017–2025, and before that ran HD Supply’s waterworks and lumber businesses
- Brian Walker — senior vice president at W.W. Grainger
- William Galvin — CEO of Anixter International 2018–2020, including through CD&R’s failed attempt to buy it; now an operating advisor to CD&R, which designated him
- Nathan Sleeper — chief executive of CD&R, also a CD&R designee; formerly on the boards of Core & Main and Beacon Roofing Supply
- Christine Gorjanc (audit chair) — former CFO of NETGEAR and Arlo
- Cynthia Hostetler (compensation and nominating chair) — a Resideo director since 2020
- Robert Aarnes
Two governance facts cut against the quality of that list. The board is classified into three classes, so a majority cannot be replaced at one annual meeting. And CD&R holds 19.7% of the vote, two seats, and a senior preferred with consent rights over any new senior or parity equity, changes to the preferred’s terms, and any voluntary bankruptcy filing. Kaufmann and Aarnes also both sit on MSC Industrial’s board.
Insiders own very little. All directors and officers together held about 283,000 shares at the spin, under 0.4% of the company. No ADI director or officer has bought or sold a share in the open market since the spin — every Form 4 filed records an award, a vesting or tax withholding. The only insider selling on file is from outside the company: Jay Geldmacher, Resideo’s former chief executive, filed seven Rule 144 notices between August 19 and September 11 covering about 206,000 shares, roughly $4.5 million, received on his Resideo holdings.
The financial record — nine years, on three bases
A spinoff’s first reported years are chosen by the parent — and here they begin just after the peak. The information statement carries 2023–2025, and it describes revenue growth of “approximately 5% compound annual growth rate from 2020” on an organic basis. Both are true. Neither shows that 2022 was the peak, because the Form 10’s first year is the first year after it. Resideo reported ADI as a segment from 2017, so the longer record exists.
The join is not clean, and the gap is measured rather than spliced. Resideo changed its segment profit measure twice. For 2023, the one year reported on all three bases, ADI’s operating income was $270 million under the 2023 10-K’s allocation, $238 million under the recast in the 2025 10-K, and $188 million on the standalone carve-out basis in the Form 10. The $82 million spread between the first and the last is corporate cost that the segment view does not carry and a standalone company does.
| Year | Revenue ($M) | Growth | Resideo segment basis | Margin | ADI standalone basis | Margin |
|---|---|---|---|---|---|---|
| 2017 | 2,477 | — | Adj. EBITDA 143 | 5.8% | — | |
| 2018 | 2,658 | +7.3% | Adj. EBITDA 164 | 6.2% | — | |
| 2019 | 2,813 | +5.8% | Op. income 210 | 7.5% | — | |
| 2020 | 2,950 | +4.9% | Op. income 194 | 6.6% | — | |
| 2021 | 3,378 | +14.5% | Op. income 268 | 7.9% | — | |
| 2022 | 3,587 | +6.2% | Op. income 313 | 8.7% | — | |
| 2023 | 3,570 | −0.5% | Op. income 270 (recast: 238) | 7.6% (6.7%) | Adj. EBITDA 238 | 6.7% |
| 2024 | 4,197 | +17.6%* | Op. income, recast 195 | 4.6% | Adj. EBITDA 286 | 6.8% |
| 2025 | 4,784 | +14.0%* | Op. income, recast 212 | 4.4% | Adj. EBITDA 318 | 6.6% |
| H1 2026 | 2,492 | +3.9% | Adj. EBITDA 169 (Resideo) | 6.8% | Adj. EBITDA 142 (incl. ~$20M refund) | 5.7% |
*Snap One contributed $553 million in 2024 (seven months) and $999 million in 2025. 2017–2018 are Resideo’s “Segment Adjusted EBITDA”; 2019–2023 its segment operating income under the allocation then in use; the recast from 2023 onwards carries more corporate cost and, from 2024, intangible amortization — $54 million in 2024 and $94 million in 2025, most of it on the intangibles acquired with Snap One. Snap One’s 2025 revenue is derived from the disclosed acquisition contributions. Standalone adjusted EBITDA adds back stock compensation.
Three things in that table matter.
First, the organic growth rate depends entirely on the start year. Excluding Snap One, revenue was $3,587 million in 2022 and about $3,785 million in 2025 — 1.8% a year over three years that included the tariff-driven price increases of 2025. From the 2020 trough the same figure compounds at about 5%, which is the number the information statement uses.
Second, the underlying margin has fallen. On the older segment basis it went 8.7% → 7.6% from 2022 to 2023. On the recast basis, adding back the Snap One amortization so the years compare, operating margin before acquired amortization went 7.0% in 2023 to 6.4% in 2025. On the standalone basis adjusted EBITDA margin has been flat at 6.6–6.8% — but only because Snap One, bought for its higher gross margin, lifted it: Snap One added 230 basis points of gross margin in 2024 and 150 in 2025, and operating income on the standalone basis still fell from $188 million to $154 million across the same two years.
Third, the company’s own 2026 guide continues the decline. Guided standalone adjusted EBITDA of $275–295 million on revenue of $4.95–5.00 billion is a 5.5–5.9% margin, and it includes the refund discussed below.
What the separation adds, and the carve-out left out (Traps 1 and 6). The historical income statement carries interest on debt allocated from Resideo — $50 million in 2025 — and allocated corporate cost. Standalone interest on the $1.0 billion raised at the spin is about $70 million a year at the pro forma 6.78% blended rate. Incremental public-company cost was about $24 million for 2025 on the company’s own estimate ($12 million in the first half; the first half of 2026 carries $6 million, because the allocations had already risen). The public-company cost is in the “standalone” EBITDA guide and the interest is in the pro forma figures; neither is in the historical net income line.
How the revenue grows — price, volume and currency. ADI discloses the split, and it is the clearest evidence in the filings about bargaining power:
| Period | Price & mix | Volume | Currency | Acquisitions |
|---|---|---|---|---|
| 2024 | −$31M | +$98M | +$4M | +$553M |
| 2025 | +$64M | +$66M | +$18M | +$446M |
| Q1 2026 | +$43M | +$32M (extra selling days; daily sales +1%) | +$15M | — |
| Q2 2026 | +$35M | −$31M | +$3M | — |
In 2024 ADI cut price — “competitive pricing pressure”, the filing says — while volume grew. In 2025 it raised price, largely by passing through tariffs on inventory it had bought before they took effect, and the information statement says so directly: “our margins benefited from raising prices due to tariffs while much of our inventory was acquired in advance of tariffs.” In the second quarter of 2026 volume fell. That is a distributor that passes through cost and holds share, not one that sets price.
The $900 million is the Honeywell bill, moved
This is the fact that explains the balance sheet, and it is not on the first page of any ADI document.
When Honeywell spun off Resideo in 2018, it attached an indemnification agreement: Resideo would pay 90% of Honeywell’s environmental costs at legacy sites, up to $140 million a year. It weighed on Resideo for seven years — the same structure Honeywell attached to Garrett Motion, spun four weeks earlier with an asbestos indemnity.
On July 30, 2025, Resideo did two things on the same day. It agreed to pay Honeywell a one-time $1,590 million to terminate the indemnity, financed with $1,225 million of new term loans. And it announced the separation of ADI. The information statement is explicit that the first enabled the second: the termination “enabled the ability to execute the separation.”
ADI’s share of that bill shows up twice: once as an allocation in its historical accounts, and once as the debt it now carries.
- Because ADI’s subsidiaries were jointly and severally liable for Resideo’s obligations, the carve-out financials were charged $364 million of indemnity expense in 2025, $79 million in 2024 and $67 million in 2023. That is why ADI reported a $261 million net loss in 2025. None of it continues.
- At the spin, ADI borrowed $1.0 billion — a $600 million secured term loan and $400 million of 7.125% notes due 2034 — and paid Resideo a $900 million dividend plus a cash true-up the Form 10 estimated at $67 million, keeping about $150 million. Resideo said it would use the cash to repay debt.
So the debt ADI carries is, in substance, most of the loan Resideo took to buy out Honeywell. The legacy liability is gone — ADI is not exposed to Honeywell’s environmental sites, which is a genuine improvement on Resideo’s own spin — but ADI’s shareholders are paying for its removal through roughly $70 million a year of interest, against a business that generated about $58 million of free cash flow in 2025 before indemnity payments — after about $50 million of interest allocated from Resideo.
ADI also inherited part of Resideo’s other financing. Resideo issued $500 million of convertible preferred to CD&R to help fund the Snap One purchase in 2024. At the spin, $150 million of it was exchanged into ADI preferred, convertible at $16.152. On the Form 10’s reading that puts CD&R at 19.69% of ADI’s vote once its 7.48 million common shares — received in the distribution on the Resideo common it held — are added to the 9.29 million shares the preferred converts into.
The preferred, and the one holder who cannot sell
The ADI preferred is worth understanding in detail, because it sets the price of every exit.
| Term | What it says |
|---|---|
| Amount | 150,000 shares, $1,000 each: $150 million of liquidation preference |
| Dividend | 7.00% a year, cumulative, payable in cash or in kind — ADI may add it to the preference instead of paying it. Also participates in any common dividend |
| Conversion | At CD&R’s option at any time, at $16.152 — 9.29 million shares. At $18.53 the conversion value is about $172 million |
| Forced conversion | After the lock-up, ADI can force conversion if the common trades above 200% of the conversion price ($32.30) for 20 of 30 days |
| Redemption | After the lock-up, ADI can redeem for two times the accumulated amount |
| Change of control | ADI may buy it out at 150% of the accumulated amount — about $225 million today |
| Lock-up | Two years from the spin, on the preferred and on CD&R’s 7.48 million common shares |
| Standstill | Capped at 19.9% until at least June 14, 2027 |
Two consequences.
The seller of the last eight weeks is not CD&R. Its entire position — about 9.9% of the common and all of the preferred — is locked up until August 2028. That also means this site’s own float figure for ADIG, which shows 99.9%, is wrong: the locked-up 7.48 million shares are not float. The shares that have traded since the spin — 42.3 million, 56% of the count, in 39 sessions — came from everyone else, and that is roughly 61% of what could trade.
And somebody has been buying. Two 13G filings dated August 31 show BlackRock at 13.5% — up from 13.0% implied by its Resideo holding at the spin — and Fidelity at 10.6%, a position that did not exist on the Form 10’s list of large holders. With CD&R’s locked 9.9%, three holders own about a third of the common. The register is turning over into long-only hands, which is consistent with the end of a post-spin flush.
And the preferred makes ADI dearer to buy. A change-of-control buyer either pays the as-converted value or, at ADI’s option, 150% of the preference; in either case the preferred takes more than its share of any premium.
Price and volume: a pop, a round trip, and a new low
| Date | Close | vs day 1 | |
|---|---|---|---|
| Day 1 (first regular-way session) | Aug 4 | $22.00 | — |
| Peak close | Aug 10 | $28.27 | +28.5% |
| Intraday high | Aug 11 | $30.99 | +40.9% |
| Resideo reports, the day before ADI | Aug 12 | $25.24 | +14.7% |
| ADI’s own results | Aug 13 | $25.82 | +17.4% |
| The day after results | Aug 14 | $21.24 | −3.5% — a −17.7% session |
| Month end | Aug 31 | $21.87 | −0.6% |
| Latest | Sep 28 | $18.53 | −15.8%, a new closing low; intraday $17.88 |
August 3 carries a thin when-issued bar (11,700 shares) and is not day one: when-issued trading is a thin market before the distribution, and the first regular-way session is August 4. The S&P 500 total return index was −0.5% over the same window.
The first week’s flow was heavy; the second week brought the results. Volume on day one was 2.8 million shares, 3.7 times the stock’s baseline, and 24% of the share count traded in the first ten sessions. The run to $28.27 came on that flow. It ended on the week of results: the stock fell 9.6% on the day Resideo reported, recovered on ADI’s own release, and then fell 17.7% the next day, when the guidance had been digested.
Both halves of Resideo have fallen, which says this is not only forced selling. A holder of two Resideo shares before the spin held about $72.45; the two Resideo shares and one ADIG share they hold now are worth $54.97, −24.1%. Resideo itself is −30.4% from its first ex-distribution close. When the parent falls further than the spinco, the explanation is not a spinco-only supply problem.
Volume has normalized and the price has not. Daily volume is back to about 0.96 times its baseline — roughly $14 million a day — while the price has kept falling. The mechanical selling this site usually looks for appears largely done.
Capital allocation
Cash generated, before the indemnity, and where it went:
| 2023 | 2024 | 2025 | H1 2026 | |
|---|---|---|---|---|
| Operating cash flow, as reported | 103 | 85 | (522) | (76) |
| Add back indemnity payments to Honeywell (allocated) | 53 | 53 | 634 | — |
| Operating cash flow before the indemnity | 156 | 138 | 112 | (76) |
| Capital expenditure | (27) | (25) | (54) | (26) |
| Free cash flow before the indemnity | 129 | 113 | 58 | (102) |
| Inventory build | (47) | (120) | (119) | (24) |
$ millions. Indemnity cash paid is the allocated expense less the change in the allocated liability; in 2025 it includes ADI’s $595 million share of the one-time termination payment. The first half is seasonally weak — the first quarter carries a large payables outflow in every year shown.
Free cash flow has halved in two years, and inventory is why: $239 million of inventory growth in 2024–2025, part of it Snap One, part of it buying ahead of tariffs. Capital spending doubled in 2025, to 1.1% of revenue; capitalized software is rising, and so is its amortization.
What management has committed to. At the July Investor Day ADI set medium-term targets: 4–6% revenue growth to about $6 billion by 2030, 40–50 basis points of gross margin expansion, adjusted EBITDA above 8% of revenue by 2030, over $80 million of run-rate cost savings by the end of 2027, and more than $1 billion of cumulative operating cash flow by 2030 — about $200 million a year, nearly twice the $112 million of operating cash flow the business generated before the indemnity in 2025. The stated priority is to reduce leverage, then tuck-in acquisitions.
What the tax matters agreement prevents. For two years from the spin — until August 2028 — ADI is subject to specific restrictions on mergers, sales of the business, stock redemptions, and issuing stock or convertibles. The term loan also carries an excess-cash-flow sweep from fiscal 2027. There will be no buyback before 2028, and probably no dividend: the preferred participates in any common dividend, and the free cash flow is spoken for.
Valuation
The capital structure. 75.92 million common shares at $18.53 is a market capitalization of $1,407 million. The preferred converts into 9.29 million more, worth $172 million as converted, which is above its $150 million preference, so I treat it as equity: 85.21 million shares on an as-converted basis, $1,579 million. Debt is $1,000 million; cash at the spin was about $150 million. Net debt $850 million, enterprise value about $2,430 million. Operating leases of $236 million are excluded throughout.
| Earnings measure | Figure | Multiple |
|---|---|---|
| 2025 adjusted EBITDA, as reported (carve-out; adds back stock compensation) | $318M | 7.6× |
| 2025 on a standalone basis, less ~$24M of public-company cost | ~$294M | 8.3× |
| 2026 guided standalone adjusted EBITDA, midpoint | $285M | 8.5× |
| 2026 guide, less the ~$20M one-time tariff refund | ~$265M | 9.2× |
| Same, with stock compensation treated as a cost | ~$241M | 10.1× |
| 2026 underlying EPS, as-converted (see below) | $1.22 | 15.1× |
Stock compensation is a real cost here, and I charge it. ADI adds back $24–25 million a year of it. For a company whose GAAP operating income was $154 million in 2025, that add-back is 16% of the earnings base.
Normalized 2026 earnings. Guided EBITDA of $285 million, less the $20 million refund and $24 million of stock compensation, is $241 million. Less about $30 million of depreciation and software amortization — but not the roughly $75 million a year of amortization on intangibles acquired with Snap One (my estimate from the disclosed increases), which is non-cash and says nothing about the business — leaves $211 million. Less $70 million of interest and a 26% tax rate: $104 million, or $1.22 per as-converted share. On ADI’s own adjusted basis, which adds stock compensation back, the same arithmetic gives $1.61.
Discounted cash flow
Assumptions, all stated:
- Starting point: 2026 revenue of $4,975 million (the guidance midpoint) at an underlying margin of 4.84% — guided EBITDA less the refund and stock compensation
- Revenue: grows at a five-year rate (base 3%), then fades to 2.5% by 2036. The record since 2022 is about 2% organic; management targets 4–6%
- Margin: glides to a terminal margin, stock compensation charged, by 2030 — base 6.0%. On the same basis the business earned 5.6% in 2023, 5.7% in 2024 and 5.6% in 2025 (standalone adjusted EBITDA less stock compensation and about $24 million of public-company cost). The base case therefore assumes 2026’s decline is recovered and about a quarter of the $80 million cost program is kept — savings in distribution are usually competed away in part
- Depreciation and non-acquired amortization 0.6% of revenue; capital expenditure 1.0% of revenue, between 2023’s 0.8% and 2025’s 1.1%
- Working capital: 20% of each dollar of revenue growth — the 2025 ratio of receivables plus inventory less payables to revenue
- Tax 26%; discount rate 9.5%; terminal growth 2.5%
- Net debt $850 million; 85.21 million as-converted shares
Base case: $16 a share, 12% below the price.
Sensitivity on the load-bearing assumptions — terminal margin down the side, five-year revenue growth across the top:
| Terminal margin | 0% | 2% | 3% | 4% | 5% | 6% |
|---|---|---|---|---|---|---|
| 4.5% | $6 | $7 | $7 | $8 | $8 | $9 |
| 5.0% | $9 | $10 | $10 | $11 | $12 | $12 |
| 5.5% | $11 | $13 | $13 | $14 | $15 | $16 |
| 6.0% | $14 | $15 | $16 | $17 | $18 | $19 |
| 6.5% | $16 | $18 | $19 | $20 | $22 | $23 |
| 7.0% | $19 | $21 | $22 | $24 | $25 | $26 |
| 7.5% — management’s 2030 target, on this basis | $21 | $24 | $25 | $27 | $28 | $30 |
About $5.90 a share for each point of terminal margin, and under a dollar for each point of growth. A point on the discount rate is worth about $4 ($21 at 8.5%, $13 at 10.5%).
Read it backwards. The market price sits at a terminal margin of about 6.3% with 3% growth — a full recovery of the 2023–2025 margin plus about half of the promised cost savings, kept. Management’s own 2030 plan — 5% growth and an 8%-plus adjusted margin, about 7.5% with stock compensation charged — is worth about $28. If the margin stays where 2026 has taken it, the equity is worth about $9. Leverage is why the range is so wide: every point of margin on $5 billion of revenue is $50 million of EBITDA, a fifth of the whole.
Earnings-based cross-check
2027 earnings on three margin assumptions, on revenue of $5,124 million (3% growth), with $31 million of depreciation and non-acquired amortization, about $68 million of interest after the term loan’s amortization, a 26% tax rate and 85.21 million as-converted shares:
| Margin, stock compensation charged | EBITDA | EPS | At $18.53 |
|---|---|---|---|
| 4.8% — 2026’s underlying margin, held | $248M | $1.29 | 14.4× |
| 6.0% — 2023–2025’s level plus a quarter of the savings | $307M | $1.81 | 10.2× |
| 7.0% — most of management’s target reached early | $359M | $2.26 | 8.2× |
Price target
| Method | Value | Weight |
|---|---|---|
| DCF, 3% five-year growth, 6.0% terminal margin | $16 | 40% |
| 11× normalized 2027 EPS of $1.81 — a discount to the closest peers’ 16.7× trailing median, for leverage and because the figure is normalized | $20 | 30% |
| 10× underlying 2026 EBITDA, a turn below the closest peers’ 11.2× median | $18 | 30% |
| Weighted target | $18 |
$18 is 3% below the current price. The three methods agree unusually closely, which is itself the finding: the price already assumes the business recovers its 2023–2025 margin and keeps a good part of the cost program. It does not assume the full plan, and it does not assume the decline continues. The peer method is explained under valuation against peers below.
What this most resembles
Four cuts against this site’s universe of spinoffs, each testing one characteristic. Figures are from the day-1 close.
1. Classic spinoffs down 15% or more at two months — a better median, the same coin. ADIG will reach its two-month mark on October 4; it stands at −15.8%. Across the universe, 38 classic spinoffs were down 15% or more at two months. Over the following ten months their median return was +20.4%, against +11.3% for all 194 classic spinoffs with the same data — but only 55% of them rose, against 60% overall, and a quarter lost more than 20%. Over two years the median was +14.3%, and exactly half were up. The flush produces a larger average rebound and no better odds.
2. The early pop that reverses — almost unprecedented. Of 313 spinoffs with a ten-day and a two-month return on file, 36 were up 15% or more within ten sessions. One of those was also down 10% or more at two months: Brookfield Business Corp, in 2022, which then fell a further 30% over the next ten months. ADIG is on course to be the second. There is no cohort here, only a warning: a strong debut normally holds, and one precedent says nothing about what happens when it does not.
3. Distribution spinoffs — unfavorable, and one of them is this business.
| SpinCo | Parent | Spun | vs Day 1 | vs S&P (ann.) | Worst point |
|---|---|---|---|---|---|
| DNOW | NOV | Jun 2014 | −54.5% | −20.0pp | −88.5% (Oct 2020) |
| Resideo | Honeywell | Oct 2018 | +1.4% | −16.1pp | −84.8% (Apr 2020) |
| ADI Global | Resideo | Aug 2026 | −15.8% | — | −15.8% |
Sendas Distributor (2021) is a Brazilian grocery chain and Concentrix (2020) a services company, both excluded as not distributors. DNOW’s decline was the 2014 oil collapse arriving in its first year; Resideo’s was the Honeywell indemnity and an operating reset. Neither is a forecast for ADI; both show how quickly a thin-margin, levered distributor’s equity moves when earnings do.
The more useful fact is the second row. ADI was inside Resideo when Resideo was spun from Honeywell in 2018, and that spin fell −84.8% from its first close to its 2020 low, carrying exactly the liability that ADI’s debt has now paid off. This is the second time this business has been spun out, and the first time without the Honeywell indemnity. That is the strongest argument that ADI’s own path need not repeat Resideo’s.
4. Sponsor-anchored spinoffs. CD&R’s position — a senior convertible preferred, two seats and a two-year lock-up — is unusual among classic spinoffs, and this site’s universe does not yet record sponsor holdings as a field, so there is no cohort to test. CD&R’s record in distribution is the nearest evidence: it owned Core & Main from 2017 and took it public in 2021, and it was a large holder of Beacon Roofing Supply, whose board Sleeper sat on until 2023.
In depth: competitive dynamics
ADI’s claim is leadership of a fragmented niche, and the filings support it with reservations. The information statement estimates the North American market for its four categories at about $65 billion — security and fire about 15%, residential AV about 10%, professional AV about 50% and data communications about 25%. ADI’s revenue is more than half security, so it is concentrated in the second-smallest of the four pools — about $10 billion of a $65 billion market — and a minor participant in the largest.
Where ADI is strong, and who it competes with:
- Security, small and mid-sized commercial and residential installers — ADI describes itself as the leading specialty distributor, “strongest in the SMB commercial and residential segments.” Its own risk disclosure names the pressure: broadline distributors “continuing to gain traction with large commercial projects through bundled offerings.” The obvious example is Wesco, which acquired Anixter and its security distribution business in 2020 — Anixter’s former CEO now sits on ADI’s board
- Residential AV — ADI, with Snap One, believes it is the leading specialty distributor, and names the threats: DIY products, manufacturers selling direct, and e-commerce platforms. Residential is also where housing weakness shows up first, and residential AV was the category that shrank in the second quarter
- Professional AV and data communications — larger pools, where ADI is growing from a smaller base against specialist AV distributors and broadline electrical and datacomm distributors
What protects the position is availability, not scarcity. ADI sells other people’s products, non-exclusively, to small installers who need them the same day. Two hundred stores and 500,000 SKUs are a real barrier for the installer who drives to a counter at 7 a.m.; they are no barrier at all for a manufacturer that decides to sell a large account direct. The largest supplier is 13.3% of revenue, and the top ten 47%.
The last three years say what that position is worth in pricing. A price cut in 2024, a tariff pass-through in 2025, falling volume in the second quarter of 2026, and gross margin — excluding the refund — down about 110 basis points on the year. Exclusive brands, the lever management points to for margin, were 17% of revenue in the first half and fell 2.7% in the second quarter.
In depth: valuation against peers
There is no listed pure play. Anixter went into Wesco in 2020 and Snap One into Resideo in 2024, so the security and AV distribution pure plays have both disappeared. The table uses listed distributors, all on one basis: trailing twelve months to each company’s latest quarter, EBITDA as GAAP operating income plus depreciation and amortization (stock compensation charged, nothing added back), enterprise value excluding operating leases and noncontrolling interests, and prices at the September 28 close.
| Company | TTM to | Revenue growth | Gross margin | EBITDA margin | EV/EBITDA | P/E | Net debt/EBITDA |
|---|---|---|---|---|---|---|---|
| ScanSource (SCSC) | Jun 2026 | +6.1% | 13.6% | 3.8% | 9.6× | 15.9× | 0.1× |
| Core & Main (CNM) | Aug 2026 | −0.5%* | 27.0% | 12.1% | 10.9× | 17.4× | 2.3× |
| Pool Corp (POOL) | Jun 2026 | +2.2% | 29.6% | 11.8% | 11.4× | 15.0× | 2.1× |
| SiteOne (SITE) | Jun 2026 | +3.3% | 35.1% | 8.1% | 11.6× | 24.9× | 1.4× |
| Wesco (WCC) | Jun 2026 | +12.5% | 21.4% | 6.2% | 14.8× | 25.2× | 3.3× |
| MSC Industrial (MSM) | May 2026 | +4.4% | 40.8% | 11.0% | 16.8× | 29.5× | 1.0× |
| Watsco (WSO) | Jun 2026 | −3.0% | 27.5% | 10.0% | 17.1× | 26.8× | — |
| W.W. Grainger (GWW) | Jun 2026 | +7.8% | 39.4% | 15.9% | 20.3× | 32.0× | 0.6× |
| Fastenal (FAST) | Jun 2026 | +12.5% | 44.7% | 22.3% | 29.6× | 43.2× | — |
| ADI Global | Jul 2026 | +3.9% (H1) | 22.0% (H1) | 4.7% | 10.7× | n.m. | 3.7× |
Computed from each company’s own 10-K and 10-Q filings; growth is reported, not organic. *Core & Main’s prior year included a 53rd week; first-half growth was +1.3%. Watsco and Fastenal carry net cash. Grainger’s multiple is understated because it consolidates about half of MonotaRO at book value. ADI’s trailing EBITDA of $227 million is on its carve-out basis — it still carries allocated corporate cost and one-time separation expense, and includes the $20 million refund; its trailing GAAP earnings include the indemnity and are not meaningful. Distribution Solutions Group is excluded: its price is fixed by a pending take-private by its controlling holders.
Two groups, and ADI belongs in the first. The four highlighted names — slow growth, branch or store networks selling to trade customers — trade at 9.6–11.6 times EBITDA, median 11.2×, and 15–25 times earnings. The rest are high-margin maintenance-supply businesses (MSC, Grainger, Fastenal) or faster growers (Wesco, on data centers), and they trade at 15–30 times for reasons ADI does not share.
On that basis ADI is priced in line, not cheap. At 10.7× trailing and about 10.1× its underlying 2026 EBITDA with stock compensation charged, it sits at the median of its closest peers — with the lowest margin in the group apart from ScanSource and the highest leverage of any of them. A turn of discount for the margin and the balance sheet — 10× underlying 2026 EBITDA of $241 million, less $850 million of net debt, over 85.21 million as-converted shares — is $18.
In depth: is ADI an acquisition target?
Not before August 2028, and the structure makes it dearer afterwards.
The clock. The tax matters agreement restricts ADI for two years from the August 3, 2026 distribution from mergers, sales of the business and changes of control that could jeopardize the spin’s tax-free status. §355(e) presumes any acquisition of 50% or more within two years to be part of a plan. The earliest unrestricted date is August 2028, the same month CD&R’s lock-up ends and the Resideo commercial agreement expires.
Who would want it:
- CD&R is the obvious candidate, and it has tried this before. In October 2019 CD&R signed an agreement to buy Anixter — a large distributor of network and security products — at $81 a share, and raised it twice, to $93.50 in cash. Wesco outbid it at a nominal $100 a share, about $4.5 billion, and paid CD&R’s $100 million break fee on Anixter’s behalf. Anixter’s chief executive through that contest was William Galvin, who now sits on ADI’s board as CD&R’s designee. CD&R already has 19.7% of ADI’s vote, two seats and a record of building distribution businesses — Core & Main above all. The standstill ends no earlier than June 14, 2027. A take-private after the lock-up is the natural end state of the position CD&R has built, and nothing in the filings says it is planned
- Wesco, which owns Anixter’s security distribution business, is the natural strategic buyer — and ADI’s own filing identifies broadline distributors as the competitive threat in large commercial security
- Other broadline distributors with security or AV exposure could want the store network, though none has shown an interest
What a buyer inherits: $1.0 billion of secured and unsecured debt, which a buyer would refinance; the preferred, at 150% of its accumulated amount or its as-converted value; a severance plan for designated officers; and a classified board that makes a hostile approach slow.
What it might cost. At the closest peers’ median of 11.2 times 2025 standalone EBITDA with stock compensation charged — about $269 million — the enterprise is worth about $3.0 billion. Less net debt of $850 million and the preferred at 150% of its preference (about $225 million), that is about $25.50 a common share, 38% above the price. That is not a forecast; it is the arithmetic of what a buyer at an ordinary distribution multiple could pay without overpaying.
What this means for the score: Acquisition Potential is 2.5. The buyer is already on the board; the clock, the preferred and the classified board all stand in front of it until 2028.
Tail scenarios
Upside tails
Management’s plan works (2σ). Revenue compounds at 5% to 2030 and the margin reaches management’s 8%-plus adjusted target — about 7.5% with stock compensation charged. The DCF gives about $28 a share (+53%). It needs the cost program delivered in full and growth at twice the recent organic rate.
A take-private after August 2028 (2σ). CD&R, or a strategic buyer, at 11–12 times 2025 standalone EBITDA (stock compensation charged) with the preferred bought out at 150%: $25–28 a share (+34–53%), two years out. The single most likely reason anyone who buys today makes money, and the one on the slowest clock.
More tariff refunds (2σ, small). ADI recognized $20 million of IEEPA refunds in the second quarter and says it “expect[s] additional recoveries.” Every further $20 million is about $0.17 a share after tax — and, because the refunds are recognized only when received, an easy beat against a guide that may not include them. Worth knowing; not worth underwriting.
Downside tails
The margin keeps going the way it has gone (2σ). Another 80 basis points of compression — the same distance it moved between 2025 and 2026 — takes the underlying margin to about 4.0% and EBITDA, stock compensation charged, to about $200 million. At today’s 10 times, less net debt, about $13 a share (−28%); if the multiple compresses to 8 times as well, about $9 (−53%). This is what three times leverage does to a 5% margin business: a single point of margin is a fifth of EBITDA.
The largest supplier goes direct, or elsewhere (2σ). One supplier was 13.3% of 2025 revenue, on agreements averaging three years, none exclusive. Losing it — or losing most of it to direct sales — removes about $650 million of revenue at a gross margin near the 22% average. With some cost removed, EBITDA falls by roughly $60–80 million, from $241 million to $161–181 million; at today’s 10 times, less net debt, about $9–11 a share (−39–52%).
Housing and commercial construction turn together (3σ). Residential is a third of product sales, and ADI’s own outlook assumes “a moderation of growth in the commercial construction market.” A 10% volume decline with gross margin under pressure could halve EBITDA for a year. The leverage covenant, first tested at the end of the third quarter of 2026 and stepping down over time, would then matter more than the valuation.
What would change this view
Better:
- Gross margin excluding tariff refunds rising year on year — the single test of whether the cost program and exclusive brands are working
- Volume growth returning, particularly in security
- Net leverage below 2.5× by the end of 2027 without asset sales
- Exclusive brands growing faster than third-party brands again
Worse:
- Another quarter of falling volume
- The guided $275–295 million missed after the refund is counted
- Paying the preferred dividend in kind — it would say the cash is not there
- An acquisition before leverage is down
Dated:
- October 4, 2026 — ADIG’s two-month mark, which settles cut 1 above
- Third-quarter results, expected November 2026 (not yet scheduled) — the first quarter as a standalone company for most of its length, the first test of the leverage covenant, and the first standalone interest charge. The most important scheduled event for this name
- June 14, 2027 — the earliest end of CD&R’s standstill
- August 2028 — the tax matters restrictions, CD&R’s lock-up and the Resideo commercial agreement all end in the same month
Thesis-breaking:
- Adjusted EBITDA below $240 million for 2026 on the company’s own basis — the guide less the refund, and $25 million more. At that level leverage is above 3.5× and the equity case rests on the 2030 plan alone
Investment Scorecard
| Dimension | Weight | Score | Rationale |
|---|---|---|---|
| Financial Profile | 25% | 2.5 | Organic growth about 2% a year since 2022, underlying margin down from the 2022 peak, 2026 guidance flattered by a ~$20M one-time refund, free cash flow before the indemnity halved in two years to $58M, and about 3× net leverage plus a senior 7% preferred. Credit for the end of the Honeywell indemnity, which removes a charge that cost $67–79M a year. The margin decline and the refund are charged here, once |
| Competitive Position | 25% | 3.0 | The leading specialty distributor of security products in North America, with 200+ stores and 100,000 installer customers, and a real residential AV position through Snap One. Held at 3.0 because the price-and-volume record shows no pricing power — a price cut in 2024, a pass-through in 2025, falling volume in 2026 — broadline distributors are gaining on large commercial work, and the top supplier is 13% of revenue on a non-exclusive agreement |
| Strategic Rationale | 20% | 2.5 | A clean, complete distribution that separates a distributor from a manufacturer whose products it sells, which is sound. Marked down because the separation was also the financing for Resideo’s exit from the Honeywell indemnity: ADI borrowed $1.0B and sent about $967M to its parent, and inherited $150M of the parent’s sponsor preferred |
| Management & Governance | 20% | 3.0 | A CEO with nine years running this business and a board of genuine distribution operators — former CEOs of Cardinal Health, Core & Main and Anixter. Offset by a 2025 below its own plan, a classified board, a sponsor holding 19.7% of the vote with consent rights, and insiders owning under 0.4% |
| Acquisition Potential | 10% | 2.5 | The natural buyer, CD&R, is already on the board, and Wesco is a logical strategic. Held down because nothing can happen before August 2028, the preferred takes 150% of its preference on a change of control, and the board is classified |
| Weighted Score | 2.73 | ||
| Investment Grade | B | Moderate Opportunity |
What moved and what deliberately did not.
The grade moves from B (2.80) in the monthly reports to B (2.73), within the same band, as filings-level evidence usually does. The movement is Financial Profile, where the refund, the pre-2023 peak and the free-cash-flow record are new evidence.
The Honeywell finding is charged once, to Strategic Rationale. It would be easy to charge it again to Financial Profile — the debt is a financial fact — but the leverage is already scored there on its own terms, and the point here is why the debt exists, which is a fact about the separation.
CD&R is described in three places and scored in two: its governance rights under Management, its likely role as a buyer under Acquisition Potential. The preferred’s cost as a claim on cash is part of the leverage already in Financial Profile, and is not charged again.
The margin decline is charged to Financial Profile, and the pricing evidence behind it to Competitive Position. They are related but they are two facts: one is what happened to the earnings, the other is what the price-and-volume record says about why.
Rating: HOLD. Target $18. This is close to the price, and the honest reading is that the market has already done most of the work: at $18.53 it discounts a full recovery to the 2023–2025 margin and about half of the promised savings, which is neither the bear case nor the plan. What would make this a BUY is evidence, not price — a quarter of gross margin growth excluding refunds and a volume number with a plus sign. Below $14, the DCF needs only the 2023–2025 margin back, with none of the savings kept, and that is where the leverage starts working for a buyer instead of against one.
A correction to this site’s own August report
The monthly report for August 31, 2026 described ADI’s second quarter as “segment adjusted EBITDA of $103M.” That is Resideo’s figure for its ADI segment, which excludes about $17 million a quarter of corporate cost. ADI’s own standalone figure for the same quarter is $86 million, and $20 million of that is the one-time tariff refund. The report also presented exclusive brands' rise from about 4% to about 18% of revenue since 2023 as the re-rating variable; almost all of that rise is the Snap One acquisition, not organic mix shift, and exclusive-brand revenue fell 2.7% in the second quarter. The report’s HOLD and B grade are consistent with this analysis. The report itself is left as published.
Nothing on this page is investment advice. Figures are drawn from the primary filings linked at the top and from this site’s own price archive; where a figure is my own calculation or estimate rather than a company statement — the underlying margin, normalized earnings, the DCF and the takeover arithmetic — that is stated in the text.