Magnum Ice Cream Company MICC
+33.4%vs Day 1Spinoff of Unilever (UL) · Classic Spinoff · Spun Dec 6, 2025
Expected return (11/13/2026): -7% Gain to loss: 0.4 : 1World's largest ice cream company: about 21% of the global market, twice Froneri, three million freezer cabinets. Base case EUR 18.0, weighted target EUR 17.1 ($19.15) against EUR 15.45; the value turns on the margin rising from 16% toward the 20% management aims for. Unilever's 19.9% is unsold with no lock-up.
Current Stats
Post-Spinoff Performance
| Timeline | |
| Spinoff date | December 6, 2025 · NYSE/Euronext/LSE |
| Days since spinoff | 343 days |
| Structure | Classic Spinoff |
| §355(e) window closes statutory; a tax matters agreement may bar more, and for longer | December 6, 2027 |
| Parent | Unilever (UL) |
| Day-1 reaction | |
| Day 1 open | $14.90 |
| Day 1 return (open→close) | +0.1% |
| Day 1 price (close) | $14.92 reported $14.90 (open) |
| Day 1 range | $14.60 – $16.00 +9.6% spread |
| Day 1 low held? | Breached after 1 session to -11.4% below |
| Price levels | |
| Post-spin low (closing) | $13.06 on Apr 29, 2026 · 142 days post-spin |
| Current price (Nov 13, 2026) | $19.90 |
| Returns | |
| Return vs Day 1 (close) | +33.4% |
| — range by day 1 entry theoretical bounds | +24.4% to +36.3% |
| Return vs post-spin low | +52.4% |
| First-quarter return (≈90d) | +2.4% |
| Versus benchmarks | |
| S&P 500 over same window | +11.6% |
| Shares & ownership | |
| Shares outstanding Jun 30, 2026 | 612,259,739 |
| Free float | 489,709,830 81% of shares outstanding |
| Held by institutions | 60% insiders 27.7% |
| Share count trend Dec 2024 → Jun 2026 | +0.0% broadly flat |
| Volume & liquidity | |
| Traded per day 20-session median | $14M |
| Normal volume baseline | 1,328,900 shares · now 0.56x |
| Day 1 volume | 5.7x normal · first week 5.8x |
| Decay | half in 10 sessions · normal by 13 |
Computed from split-adjusted closing prices. Returns are total return — (end price + dividends received − start price) ÷ start price — with no reinvestment assumed.
Price History
Closing price, split-adjusted, with volume below. No dividends have been paid, so price return and total return are the same. Source: Yahoo Finance. Data through Nov 14, 2026.
Raw daily price & volume data
| Date | Open | High | Low | Close | Volume | Float | Turnover | Market cap | Dividend | Split |
|---|---|---|---|---|---|---|---|---|---|---|
| 2026-11-13 | $19.77 | $19.92 | $19.77 | $19.90 | 449,400 | 489,709,830 | 0.07% | $12.18B | — | — |
| 2026-11-12 | $19.77 | $19.87 | $19.66 | $19.67 | 575,300 | 489,709,830 | 0.09% | $12.04B | — | — |
| 2026-11-11 | $19.60 | $19.74 | $19.56 | $19.72 | 569,300 | 489,709,830 | 0.09% | $12.07B | — | — |
| 2026-11-10 | $19.87 | $19.99 | $19.61 | $19.89 | 603,200 | 489,709,830 | 0.10% | $12.18B | — | — |
| 2026-11-09 | $19.51 | $19.76 | $19.42 | $19.70 | 767,500 | 489,709,830 | 0.13% | $12.06B | — | — |
| 2026-11-06 | $19.41 | $19.75 | $19.33 | $19.44 | 1,520,100 | 489,709,830 | 0.25% | $11.90B | — | — |
| 2026-11-05 | $20.13 | $20.34 | $19.96 | $20.11 | 1,384,900 | 489,709,830 | 0.23% | $12.31B | — | — |
| 2026-11-04 | $19.89 | $20.25 | $19.84 | $20.14 | 822,700 | 489,709,830 | 0.13% | $12.33B | — | — |
| 2026-11-03 | $19.59 | $19.64 | $19.38 | $19.39 | 769,900 | 489,709,830 | 0.13% | $11.87B | — | — |
| 2026-11-02 | $20.14 | $20.27 | $20.06 | $20.26 | 756,900 | 489,709,830 | 0.12% | $12.40B | — | — |
| 2026-10-30 | $19.94 | $20.02 | $19.65 | $19.87 | 1,167,400 | 489,709,830 | 0.19% | $12.17B | — | — |
| 2026-10-29 | $19.43 | $19.49 | $18.84 | $18.87 | 1,743,800 | 489,709,830 | 0.28% | $11.55B | — | — |
| 2026-10-28 | $19.09 | $19.36 | $19.09 | $19.30 | 717,200 | 489,709,830 | 0.12% | $11.82B | — | — |
| 2026-10-27 | $19.21 | $19.34 | $19.14 | $19.25 | 829,200 | 489,709,830 | 0.14% | $11.79B | — | — |
| 2026-10-26 | $19.09 | $19.72 | $19.09 | $19.42 | 1,711,500 | 489,709,830 | 0.28% | $11.89B | — | — |
| 2026-10-23 | $19.24 | $19.30 | $18.93 | $19.05 | 555,100 | 489,709,830 | 0.09% | $11.66B | — | — |
| 2026-10-22 | $18.90 | $19.42 | $18.83 | $19.39 | 506,400 | 489,709,830 | 0.08% | $11.87B | — | — |
| 2026-10-21 | $19.06 | $19.09 | $18.88 | $18.95 | 450,700 | 489,709,830 | 0.07% | $11.60B | — | — |
| 2026-10-20 | $18.92 | $19.01 | $18.79 | $18.99 | 557,300 | 489,709,830 | 0.09% | $11.63B | — | — |
| 2026-10-19 | $18.67 | $18.90 | $18.67 | $18.80 | 625,100 | 489,709,830 | 0.10% | $11.51B | — | — |
| 2026-10-16 | $18.66 | $18.88 | $18.65 | $18.78 | 605,500 | 489,709,830 | 0.10% | $11.50B | — | — |
| 2026-10-15 | $18.63 | $18.67 | $18.41 | $18.44 | 605,900 | 489,709,830 | 0.10% | $11.29B | — | — |
| 2026-10-14 | $17.96 | $18.20 | $17.85 | $18.19 | 789,300 | 489,709,830 | 0.13% | $11.14B | — | — |
| 2026-10-13 | $18.20 | $18.24 | $17.68 | $17.70 | 1,309,700 | 489,709,830 | 0.21% | $10.84B | — | — |
| 2026-10-12 | $17.44 | $17.83 | $17.44 | $17.83 | 640,000 | 489,709,830 | 0.10% | $10.92B | — | — |
| 2026-10-09 | $17.37 | $17.39 | $17.15 | $17.28 | 798,700 | 489,709,830 | 0.13% | $10.58B | — | — |
| 2026-10-08 | $16.99 | $17.44 | $16.99 | $17.44 | 1,160,100 | 489,709,830 | 0.19% | $10.68B | — | — |
| 2026-10-07 | $16.90 | $17.08 | $16.86 | $16.96 | 797,900 | 489,709,830 | 0.13% | $10.38B | — | — |
| 2026-10-06 | $17.24 | $17.42 | $17.17 | $17.18 | 951,800 | 489,709,830 | 0.16% | $10.52B | — | — |
| 2026-10-05 | $17.20 | $17.24 | $17.06 | $17.11 | 1,001,400 | 489,709,830 | 0.16% | $10.48B | — | — |
| 2026-10-02 | $17.25 | $17.49 | $17.20 | $17.48 | 661,400 | 489,709,830 | 0.11% | $10.70B | — | — |
| 2026-10-01 | $17.12 | $17.25 | $17.07 | $17.18 | 1,151,800 | 489,709,830 | 0.19% | $10.52B | — | — |
| 2026-09-30 | $18.27 | $18.30 | $17.76 | $17.78 | 1,048,200 | 489,489,416 | 0.17% | $10.89B | — | — |
| 2026-09-29 | $18.42 | $18.57 | $18.34 | $18.55 | 598,300 | 489,489,416 | 0.10% | $11.36B | — | — |
| 2026-09-28 | $18.76 | $18.97 | $18.72 | $18.80 | 488,600 | 489,489,416 | 0.08% | $11.51B | — | — |
| 2026-09-25 | $19.02 | $19.13 | $18.83 | $18.98 | 490,100 | 489,489,416 | 0.08% | $11.62B | — | — |
| 2026-09-24 | $19.40 | $19.40 | $19.14 | $19.28 | 787,800 | 489,489,416 | 0.13% | $11.80B | — | — |
| 2026-09-23 | $19.47 | $19.49 | $19.01 | $19.06 | 868,800 | 489,489,416 | 0.14% | $11.67B | — | — |
| 2026-09-22 | $19.58 | $19.58 | $19.24 | $19.32 | 661,500 | 489,489,416 | 0.11% | $11.83B | — | — |
| 2026-09-21 | $19.18 | $19.31 | $19.08 | $19.25 | 451,200 | 489,489,416 | 0.07% | $11.79B | — | — |
| 2026-09-18 | $18.94 | $19.00 | $18.80 | $18.98 | 974,400 | 489,489,416 | 0.16% | $11.62B | — | — |
| 2026-09-17 | $19.15 | $19.27 | $18.92 | $18.93 | 980,900 | 489,489,416 | 0.16% | $11.59B | — | — |
| 2026-09-16 | $19.02 | $19.13 | $18.78 | $18.80 | 593,200 | 489,489,416 | 0.10% | $11.51B | — | — |
| 2026-09-15 | $19.45 | $19.50 | $19.16 | $19.18 | 520,300 | 489,489,416 | 0.08% | $11.74B | — | — |
| 2026-09-14 | $19.93 | $20.04 | $19.75 | $19.91 | 815,300 | 489,489,416 | 0.13% | $12.19B | — | — |
| 2026-09-11 | $19.74 | $19.88 | $19.53 | $19.65 | 902,700 | 489,489,416 | 0.15% | $12.03B | — | — |
| 2026-09-10 | $19.23 | $19.58 | $19.07 | $19.50 | 861,000 | 489,489,416 | 0.14% | $11.94B | — | — |
| 2026-09-09 | $19.70 | $19.72 | $19.11 | $19.13 | 1,372,700 | 489,489,416 | 0.22% | $11.71B | — | — |
| 2026-09-08 | $19.17 | $19.55 | $19.10 | $19.33 | 758,500 | 489,489,416 | 0.12% | $11.83B | — | — |
| 2026-09-04 | $19.21 | $19.51 | $19.08 | $19.32 | 914,200 | 489,489,416 | 0.15% | $11.83B | — | — |
| 2026-09-03 | $19.92 | $19.95 | $19.57 | $19.74 | 870,900 | 489,489,416 | 0.14% | $12.09B | — | — |
| 2026-09-02 | $19.72 | $19.95 | $19.48 | $19.85 | 815,100 | 489,489,416 | 0.13% | $12.15B | — | — |
| 2026-09-01 | $20.02 | $20.28 | $19.69 | $19.73 | 749,600 | 489,489,416 | 0.12% | $12.08B | — | — |
| 2026-08-31 | $20.31 | $20.68 | $20.26 | $20.42 | 933,700 | 489,489,416 | 0.15% | $12.50B | — | — |
| 2026-08-28 | $20.09 | $20.26 | $20.08 | $20.18 | 433,100 | 489,489,416 | 0.07% | $12.36B | — | — |
| 2026-08-27 | $20.10 | $20.22 | $20.00 | $20.08 | 441,700 | 489,489,416 | 0.07% | $12.29B | — | — |
| 2026-08-26 | $20.40 | $20.46 | $20.25 | $20.27 | 523,800 | 489,489,416 | 0.09% | $12.41B | — | — |
| 2026-08-25 | $20.18 | $20.30 | $20.06 | $20.29 | 1,088,000 | 489,489,416 | 0.18% | $12.42B | — | — |
| 2026-08-24 | $20.33 | $20.49 | $20.09 | $20.15 | 848,600 | 489,489,416 | 0.14% | $12.34B | — | — |
| 2026-08-21 | $19.83 | $19.97 | $19.75 | $19.96 | 471,400 | 489,489,416 | 0.08% | $12.22B | — | — |
| 2026-08-20 | $19.64 | $19.85 | $19.56 | $19.74 | 831,000 | 489,489,416 | 0.14% | $12.09B | — | — |
| 2026-08-19 | $19.59 | $19.69 | $19.33 | $19.41 | 1,030,000 | 489,489,416 | 0.17% | $11.88B | — | — |
| 2026-08-18 | $18.88 | $19.17 | $18.88 | $18.98 | 1,290,900 | 489,489,416 | 0.21% | $11.62B | — | — |
| 2026-08-17 | $19.25 | $19.25 | $18.99 | $19.01 | 562,900 | 489,489,416 | 0.09% | $11.64B | — | — |
| 2026-08-14 | $19.67 | $19.75 | $19.52 | $19.58 | 484,100 | 489,489,416 | 0.08% | $11.99B | — | — |
| 2026-08-13 | $19.79 | $20.10 | $19.77 | $20.09 | 615,200 | — | 0.10% | $12.30B | — | — |
| 2026-08-12 | $19.55 | $19.67 | $19.41 | $19.67 | 877,800 | — | 0.14% | $12.04B | — | — |
| 2026-08-11 | $19.13 | $19.43 | $19.09 | $19.43 | 501,200 | — | 0.08% | $11.90B | — | — |
| 2026-08-10 | $19.24 | $19.34 | $19.09 | $19.20 | 710,000 | — | 0.12% | $11.76B | — | — |
| 2026-08-07 | $19.00 | $19.29 | $19.00 | $19.27 | 658,000 | — | 0.11% | $11.80B | — | — |
| 2026-08-06 | $18.92 | $19.05 | $18.86 | $18.92 | 511,600 | — | 0.08% | $11.58B | — | — |
| 2026-08-05 | $19.07 | $19.07 | $18.78 | $18.85 | 984,500 | — | 0.16% | $11.54B | — | — |
| 2026-08-04 | $18.38 | $18.67 | $18.27 | $18.29 | 982,300 | — | 0.16% | $11.20B | — | — |
| 2026-08-03 | $18.70 | $18.71 | $18.36 | $18.37 | 533,200 | — | 0.09% | $11.25B | — | — |
| 2026-07-31 | $18.54 | $18.67 | $18.32 | $18.61 | 919,200 | — | 0.15% | $11.39B | — | — |
| 2026-07-30 | $18.48 | $18.75 | $18.41 | $18.74 | 1,049,400 | — | 0.17% | $11.47B | — | — |
| 2026-07-29 | $18.28 | $18.52 | $18.17 | $18.24 | 719,900 | — | 0.12% | $11.17B | — | — |
| 2026-07-28 | $18.40 | $18.73 | $18.39 | $18.50 | 893,400 | — | 0.15% | $11.33B | — | — |
| 2026-07-27 | $18.10 | $18.31 | $18.04 | $18.04 | 971,700 | — | 0.16% | $11.05B | — | — |
| 2026-07-24 | $17.93 | $17.98 | $17.83 | $17.84 | 426,000 | — | 0.07% | $10.92B | — | — |
| 2026-07-23 | $17.44 | $17.81 | $17.39 | $17.74 | 825,700 | — | 0.13% | $10.86B | — | — |
| 2026-07-22 | $18.24 | $18.33 | $18.01 | $18.07 | 900,900 | — | 0.15% | $11.06B | — | — |
| 2026-07-21 | $18.20 | $18.28 | $17.87 | $17.88 | 863,500 | — | 0.14% | $10.95B | — | — |
| 2026-07-20 | $18.77 | $18.82 | $18.52 | $18.65 | 2,513,500 | — | 0.41% | $11.42B | — | — |
| 2026-07-17 | $18.83 | $18.88 | $18.59 | $18.70 | 1,008,300 | — | 0.16% | $11.45B | — | — |
| 2026-07-16 | $18.56 | $18.90 | $18.47 | $18.82 | 905,300 | — | 0.15% | $11.52B | — | — |
| 2026-07-15 | $18.49 | $18.96 | $18.49 | $18.68 | 2,114,700 | — | 0.35% | $11.44B | — | — |
| 2026-07-14 | $18.46 | $18.71 | $18.30 | $18.51 | 1,431,000 | — | 0.23% | $11.33B | — | — |
| 2026-07-13 | $18.63 | $18.69 | $18.45 | $18.46 | 998,200 | — | 0.16% | $11.30B | — | — |
| 2026-07-10 | $18.44 | $18.86 | $18.38 | $18.53 | 1,710,800 | — | 0.28% | $11.35B | — | — |
| 2026-07-09 | $18.32 | $18.46 | $18.08 | $18.38 | 1,607,600 | — | 0.26% | $11.25B | — | — |
| 2026-07-08 | $18.61 | $18.61 | $18.43 | $18.44 | 934,500 | — | 0.15% | $11.29B | — | — |
| 2026-07-07 | $19.00 | $19.14 | $18.74 | $18.84 | 1,452,300 | — | 0.24% | $11.53B | — | — |
| 2026-07-06 | $18.59 | $18.82 | $18.41 | $18.76 | 1,004,900 | — | 0.16% | $11.49B | — | — |
| 2026-07-02 | $18.63 | $18.74 | $18.43 | $18.72 | 1,226,400 | — | 0.20% | $11.46B | — | — |
| 2026-07-01 | $17.63 | $18.09 | $17.57 | $18.09 | 1,001,500 | — | 0.16% | $11.08B | — | — |
| 2026-06-30 | $17.41 | $17.47 | $17.32 | $17.41 | 1,090,400 | — | 0.18% | $10.66B | — | — |
| 2026-06-29 | $17.46 | $17.67 | $17.43 | $17.56 | 1,382,800 | — | 0.23% | $10.75B | — | — |
| 2026-06-26 | $17.27 | $17.57 | $17.24 | $17.50 | 1,328,700 | — | 0.22% | $10.71B | — | — |
| 2026-06-25 | $16.98 | $17.38 | $16.98 | $17.21 | 1,172,700 | — | 0.19% | $10.54B | — | — |
| 2026-06-24 | $16.93 | $17.10 | $16.85 | $17.03 | 1,027,300 | — | 0.17% | $10.43B | — | — |
| 2026-06-23 | $16.51 | $16.79 | $16.49 | $16.74 | 1,387,200 | — | 0.23% | $10.25B | — | — |
| 2026-06-22 | $16.38 | $16.65 | $16.05 | $16.35 | 3,512,200 | — | 0.57% | $10.01B | — | — |
| 2026-06-18 | $16.59 | $16.88 | $16.59 | $16.77 | 2,048,800 | — | 0.33% | $10.27B | — | — |
| 2026-06-17 | $17.33 | $17.49 | $17.03 | $17.08 | 1,160,500 | — | 0.19% | $10.46B | — | — |
| 2026-06-16 | $17.70 | $17.73 | $17.32 | $17.43 | 2,003,500 | — | 0.33% | $10.67B | — | — |
| 2026-06-15 | $17.96 | $18.04 | $17.76 | $17.82 | 1,204,800 | — | 0.20% | $10.91B | — | — |
| 2026-06-12 | $17.83 | $17.99 | $17.65 | $17.92 | 1,237,300 | — | 0.20% | $10.97B | — | — |
| 2026-06-11 | $17.88 | $18.16 | $17.77 | $18.03 | 1,881,400 | — | 0.31% | $11.04B | — | — |
| 2026-06-10 | $17.47 | $17.83 | $17.47 | $17.76 | 1,085,300 | — | 0.18% | $10.87B | — | — |
| 2026-06-09 | $17.05 | $17.46 | $17.03 | $17.46 | 823,300 | — | 0.13% | $10.69B | — | — |
| 2026-06-08 | $17.17 | $17.33 | $16.94 | $16.98 | 1,409,700 | — | 0.23% | $10.40B | — | — |
| 2026-06-05 | $17.20 | $17.32 | $17.00 | $17.07 | 1,250,400 | — | 0.20% | $10.45B | — | — |
| 2026-06-04 | $17.08 | $17.16 | $16.90 | $17.03 | 1,302,700 | — | 0.21% | $10.43B | — | — |
| 2026-06-03 | $16.73 | $16.82 | $16.66 | $16.72 | 1,202,800 | — | 0.20% | $10.24B | — | — |
| 2026-06-02 | $16.42 | $16.83 | $16.41 | $16.80 | 1,626,500 | — | 0.27% | $10.29B | — | — |
| 2026-06-01 | $15.85 | $16.23 | $15.82 | $16.23 | 1,500,200 | — | 0.25% | $9.94B | — | — |
| 2026-05-29 | $16.50 | $16.52 | $16.20 | $16.20 | 1,200,500 | — | 0.20% | $9.92B | — | — |
| 2026-05-28 | $16.20 | $16.48 | $16.16 | $16.38 | 772,500 | — | 0.13% | $10.03B | — | — |
| 2026-05-27 | $16.03 | $16.50 | $16.03 | $16.33 | 944,500 | — | 0.15% | $10.00B | — | — |
| 2026-05-26 | $16.00 | $16.05 | $15.63 | $15.66 | 863,300 | — | 0.14% | $9.59B | — | — |
| 2026-05-22 | $16.02 | $16.20 | $16.00 | $16.05 | 847,700 | — | 0.14% | $9.83B | — | — |
| 2026-05-21 | $15.92 | $16.34 | $15.89 | $16.27 | 1,522,500 | — | 0.25% | $9.96B | — | — |
| 2026-05-20 | $15.65 | $16.14 | $15.65 | $16.14 | 1,524,500 | — | 0.25% | $9.88B | — | — |
| 2026-05-19 | $15.59 | $15.72 | $15.48 | $15.49 | 1,261,300 | — | 0.21% | $9.48B | — | — |
| 2026-05-18 | $15.81 | $16.16 | $15.71 | $15.74 | 1,928,300 | — | 0.31% | $9.64B | — | — |
| 2026-05-15 | $16.98 | $17.03 | $16.31 | $16.66 | 7,284,300 | — | 1.19% | $10.20B | — | — |
| 2026-05-14 | $14.95 | $15.20 | $14.89 | $15.02 | 877,100 | — | 0.14% | $9.20B | — | — |
| 2026-05-13 | $14.94 | $15.06 | $14.75 | $14.76 | 677,900 | — | 0.11% | $9.04B | — | — |
| 2026-05-12 | $15.08 | $15.19 | $14.97 | $15.09 | 831,700 | — | 0.14% | $9.24B | — | — |
| 2026-05-11 | $14.83 | $14.88 | $14.73 | $14.87 | 857,800 | — | 0.14% | $9.10B | — | — |
| 2026-05-08 | $14.84 | $14.87 | $14.74 | $14.79 | 703,300 | — | 0.11% | $9.06B | — | — |
| 2026-05-07 | $14.76 | $14.85 | $14.57 | $14.67 | 1,130,300 | — | 0.18% | $8.98B | — | — |
| 2026-05-06 | $15.44 | $15.50 | $15.07 | $15.07 | 800,400 | — | 0.13% | $9.23B | — | — |
| 2026-05-05 | $14.70 | $15.15 | $14.63 | $15.09 | 1,401,800 | — | 0.23% | $9.24B | — | — |
| 2026-05-04 | $15.37 | $15.41 | $15.12 | $15.17 | 1,429,200 | — | 0.23% | $9.29B | — | — |
| 2026-05-01 | $14.58 | $15.19 | $14.58 | $14.85 | 2,332,000 | — | 0.38% | $9.09B | — | — |
| 2026-04-30 | $14.21 | $15.02 | $14.12 | $14.93 | 7,115,300 | — | 1.16% | $9.14B | — | — |
| 2026-04-29 | $13.10 | $13.14 | $12.94 | $13.06 | 1,765,700 | — | 0.29% | $8.00B | — | — |
| 2026-04-28 | $13.04 | $13.23 | $13.02 | $13.19 | 1,388,200 | — | 0.23% | $8.08B | — | — |
| 2026-04-27 | $13.16 | $13.30 | $12.97 | $13.08 | 1,716,000 | — | 0.28% | $8.01B | — | — |
| 2026-04-24 | $13.18 | $13.27 | $13.13 | $13.23 | 682,200 | — | 0.11% | $8.10B | — | — |
| 2026-04-23 | $13.23 | $13.26 | $13.12 | $13.15 | 1,660,500 | — | 0.27% | $8.05B | — | — |
| 2026-04-22 | $13.36 | $13.41 | $13.06 | $13.07 | 1,164,400 | — | 0.19% | $8.00B | — | — |
| 2026-04-21 | $13.75 | $13.93 | $13.46 | $13.46 | 1,611,000 | — | 0.26% | $8.24B | — | — |
| 2026-04-20 | $14.29 | $14.37 | $14.15 | $14.19 | 1,070,000 | — | 0.17% | $8.69B | — | — |
| 2026-04-17 | $14.43 | $14.59 | $14.40 | $14.58 | 1,023,500 | — | 0.17% | $8.93B | — | — |
| 2026-04-16 | $14.13 | $14.38 | $14.11 | $14.15 | 1,148,800 | — | 0.19% | $8.66B | — | — |
| 2026-04-15 | $14.19 | $14.23 | $14.04 | $14.06 | 1,295,200 | — | 0.21% | $8.61B | — | — |
| 2026-04-14 | $14.22 | $14.32 | $14.09 | $14.09 | 2,241,700 | — | 0.37% | $8.63B | — | — |
| 2026-04-13 | $14.00 | $14.32 | $13.96 | $14.31 | 1,170,600 | — | 0.19% | $8.76B | — | — |
| 2026-04-10 | $14.53 | $14.59 | $14.38 | $14.46 | 938,200 | — | 0.15% | $8.85B | — | — |
| 2026-04-09 | $14.40 | $14.66 | $14.28 | $14.60 | 1,452,800 | — | 0.24% | $8.94B | — | — |
| 2026-04-08 | $14.68 | $14.81 | $14.56 | $14.57 | 1,497,000 | — | 0.24% | $8.92B | — | — |
| 2026-04-07 | $14.35 | $14.47 | $14.32 | $14.36 | 2,093,800 | — | 0.34% | $8.79B | — | — |
| 2026-04-06 | $14.27 | $14.63 | $14.26 | $14.61 | 980,200 | — | 0.16% | $8.95B | — | — |
| 2026-04-02 | $14.33 | $14.45 | $14.15 | $14.30 | 1,014,400 | — | 0.17% | $8.76B | — | — |
| 2026-04-01 | $14.59 | $14.60 | $14.32 | $14.43 | 2,525,700 | — | 0.41% | $8.83B | — | — |
| 2026-03-31 | $14.73 | $14.99 | $14.52 | $14.95 | 1,700,900 | — | 0.28% | $9.15B | — | — |
| 2026-03-30 | $14.80 | $15.01 | $14.80 | $14.95 | 1,361,200 | — | 0.22% | $9.15B | — | — |
| 2026-03-27 | $14.60 | $14.71 | $14.56 | $14.63 | 790,600 | — | 0.13% | $8.96B | — | — |
| 2026-03-26 | $14.79 | $14.97 | $14.64 | $14.64 | 1,126,300 | — | 0.18% | $8.96B | — | — |
| 2026-03-25 | $14.56 | $14.72 | $14.51 | $14.65 | 1,183,100 | — | 0.19% | $8.97B | — | — |
| 2026-03-24 | $14.55 | $15.09 | $14.44 | $14.56 | 3,171,900 | — | 0.52% | $8.91B | — | — |
| 2026-03-23 | $14.84 | $15.35 | $14.62 | $14.74 | 2,047,900 | — | 0.33% | $9.02B | — | — |
| 2026-03-20 | $14.97 | $15.12 | $14.83 | $14.85 | 1,811,900 | — | 0.30% | $9.09B | — | — |
| 2026-03-19 | $15.13 | $15.40 | $15.01 | $15.11 | 2,166,400 | — | 0.35% | $9.25B | — | — |
| 2026-03-18 | $15.50 | $15.58 | $15.34 | $15.35 | 1,430,800 | — | 0.23% | $9.40B | — | — |
| 2026-03-17 | $15.75 | $15.92 | $15.61 | $15.61 | 1,344,900 | — | 0.22% | $9.56B | — | — |
| 2026-03-16 | $15.48 | $15.68 | $15.45 | $15.65 | 938,700 | — | 0.15% | $9.58B | — | — |
| 2026-03-13 | $15.60 | $15.74 | $15.38 | $15.50 | 1,456,600 | — | 0.24% | $9.49B | — | — |
| 2026-03-12 | $15.36 | $15.56 | $15.29 | $15.33 | 1,443,800 | — | 0.24% | $9.39B | — | — |
| 2026-03-11 | $15.52 | $15.60 | $15.39 | $15.50 | 1,345,800 | — | 0.22% | $9.49B | — | — |
| 2026-03-10 | $15.15 | $15.40 | $15.11 | $15.29 | 1,158,000 | — | 0.19% | $9.36B | — | — |
| 2026-03-09 | $15.01 | $15.29 | $14.95 | $15.28 | 1,446,900 | — | 0.24% | $9.36B | — | — |
| 2026-03-06 | $15.13 | $15.32 | $15.06 | $15.28 | 712,300 | — | 0.12% | $9.36B | — | — |
| 2026-03-05 | $15.20 | $15.29 | $15.10 | $15.22 | 1,105,700 | — | 0.18% | $9.32B | — | — |
| 2026-03-04 | $15.43 | $15.52 | $15.35 | $15.49 | 1,332,600 | — | 0.22% | $9.48B | — | — |
| 2026-03-03 | $14.94 | $15.15 | $14.89 | $15.11 | 1,833,900 | — | 0.30% | $9.25B | — | — |
| 2026-03-02 | $15.57 | $15.62 | $15.32 | $15.44 | 1,394,300 | — | 0.23% | $9.45B | — | — |
| 2026-02-27 | $15.90 | $15.92 | $15.72 | $15.87 | 942,700 | — | 0.15% | $9.72B | — | — |
| 2026-02-26 | $15.76 | $16.28 | $15.76 | $16.17 | 2,141,500 | — | 0.35% | $9.90B | — | — |
| 2026-02-25 | $16.21 | $16.29 | $16.05 | $16.10 | 785,800 | — | 0.13% | $9.86B | — | — |
| 2026-02-24 | $15.95 | $16.43 | $15.93 | $16.42 | 1,387,100 | — | 0.23% | $10.05B | — | — |
| 2026-02-23 | $16.00 | $16.02 | $15.76 | $15.76 | 1,816,700 | — | 0.30% | $9.65B | — | — |
| 2026-02-20 | $16.53 | $16.75 | $16.43 | $16.65 | 1,325,200 | — | 0.22% | $10.19B | — | — |
| 2026-02-19 | $15.90 | $16.55 | $15.88 | $16.42 | 3,221,200 | — | 0.53% | $10.05B | — | — |
| 2026-02-18 | $15.98 | $16.16 | $15.83 | $16.09 | 1,250,400 | — | 0.20% | $9.85B | — | — |
| 2026-02-17 | $16.18 | $16.26 | $15.60 | $15.91 | 3,270,500 | — | 0.53% | $9.74B | — | — |
| 2026-02-13 | $16.87 | $17.01 | $16.50 | $16.83 | 1,675,900 | — | 0.27% | $10.30B | — | — |
| 2026-02-12 | $16.83 | $17.25 | $15.98 | $16.31 | 5,126,900 | — | 0.84% | $9.99B | — | — |
| 2026-02-11 | $19.34 | $19.93 | $19.28 | $19.87 | 763,600 | — | 0.12% | $12.17B | — | — |
| 2026-02-10 | $18.93 | $19.27 | $18.90 | $19.21 | 644,400 | — | 0.11% | $11.76B | — | — |
| 2026-02-09 | $19.30 | $19.40 | $18.70 | $18.87 | 1,026,600 | — | 0.17% | $11.55B | — | — |
| 2026-02-06 | $19.33 | $19.48 | $19.09 | $19.22 | 1,955,100 | — | 0.32% | $11.77B | — | — |
| 2026-02-05 | $18.70 | $18.77 | $18.56 | $18.62 | 1,626,200 | — | 0.27% | $11.40B | — | — |
| 2026-02-04 | $18.09 | $18.36 | $18.06 | $18.30 | 1,240,600 | — | 0.20% | $11.20B | — | — |
| 2026-02-03 | $17.61 | $17.93 | $17.61 | $17.79 | 748,100 | — | 0.12% | $10.89B | — | — |
| 2026-02-02 | $17.60 | $17.75 | $17.45 | $17.53 | 710,900 | — | 0.12% | $10.73B | — | — |
| 2026-01-30 | $17.89 | $17.99 | $17.64 | $17.75 | 845,000 | — | 0.14% | $10.87B | — | — |
| 2026-01-29 | $18.22 | $18.26 | $17.89 | $17.96 | 724,500 | — | 0.12% | $11.00B | — | — |
| 2026-01-28 | $17.81 | $18.06 | $17.69 | $17.81 | 699,600 | — | 0.11% | $10.90B | — | — |
| 2026-01-27 | $17.91 | $17.91 | $17.56 | $17.59 | 1,210,900 | — | 0.20% | $10.77B | — | — |
| 2026-01-26 | $17.82 | $18.39 | $17.79 | $18.24 | 1,891,300 | — | 0.31% | $11.17B | — | — |
| 2026-01-23 | $16.55 | $16.88 | $16.51 | $16.84 | 583,900 | — | 0.10% | $10.31B | — | — |
| 2026-01-22 | $16.32 | $16.48 | $16.26 | $16.31 | 1,118,700 | — | 0.18% | $9.99B | — | — |
| 2026-01-21 | $16.69 | $16.77 | $16.34 | $16.46 | 1,341,200 | — | 0.22% | $10.08B | — | — |
| 2026-01-20 | $16.80 | $16.98 | $16.75 | $16.89 | 827,600 | — | 0.14% | $10.34B | — | — |
| 2026-01-16 | $16.63 | $16.73 | $16.53 | $16.70 | 1,354,800 | — | 0.22% | $10.22B | — | — |
| 2026-01-15 | $16.09 | $16.33 | $16.04 | $16.26 | 1,010,000 | — | 0.16% | $9.96B | — | — |
| 2026-01-14 | $15.81 | $16.35 | $15.81 | $16.33 | 1,575,800 | — | 0.26% | $10.00B | — | — |
| 2026-01-13 | $15.12 | $15.39 | $15.10 | $15.32 | 1,184,500 | — | 0.19% | $9.38B | — | — |
| 2026-01-12 | $15.15 | $15.27 | $15.15 | $15.24 | 1,347,100 | — | 0.22% | $9.33B | — | — |
| 2026-01-09 | $15.35 | $15.41 | $15.13 | $15.28 | 1,933,000 | — | 0.32% | $9.36B | — | — |
| 2026-01-08 | $15.10 | $15.32 | $15.10 | $15.20 | 834,500 | — | 0.14% | $9.31B | — | — |
| 2026-01-07 | $15.18 | $15.29 | $15.14 | $15.17 | 1,518,000 | — | 0.25% | $9.29B | — | — |
| 2026-01-06 | $15.00 | $15.34 | $15.00 | $15.21 | 1,746,400 | — | 0.29% | $9.31B | — | — |
| 2026-01-05 | $15.23 | $15.29 | $14.87 | $14.97 | 2,115,100 | — | 0.35% | $9.17B | — | — |
| 2026-01-02 | $15.85 | $15.91 | $15.49 | $15.50 | 968,100 | — | 0.16% | $9.49B | — | — |
| 2025-12-31 | $15.87 | $15.97 | $15.84 | $15.85 | 824,300 | — | 0.13% | $9.70B | — | — |
| 2025-12-30 | $15.75 | $15.92 | $15.69 | $15.90 | 894,000 | — | 0.15% | $9.73B | — | — |
| 2025-12-29 | $15.71 | $15.80 | $15.61 | $15.72 | 1,101,200 | — | 0.18% | $9.62B | — | — |
| 2025-12-26 | $15.55 | $15.73 | $15.55 | $15.72 | 574,200 | — | 0.09% | $9.62B | — | — |
| 2025-12-24 | $15.75 | $15.78 | $15.57 | $15.63 | 372,800 | — | 0.06% | $9.57B | — | — |
| 2025-12-23 | $15.72 | $15.78 | $15.52 | $15.67 | 1,647,500 | — | 0.27% | $9.59B | — | — |
| 2025-12-22 | $15.86 | $15.90 | $15.70 | $15.83 | 2,628,900 | — | 0.43% | $9.69B | — | — |
| 2025-12-19 | $15.95 | $15.99 | $15.81 | $15.88 | 4,583,100 | — | 0.75% | $9.72B | — | — |
| 2025-12-18 | $15.92 | $16.09 | $15.85 | $15.97 | 2,870,700 | — | 0.47% | $9.78B | — | — |
| 2025-12-17 | $16.32 | $16.40 | $15.66 | $15.84 | 3,737,000 | — | 0.61% | $9.70B | — | — |
| 2025-12-16 | $16.32 | $16.45 | $16.10 | $16.19 | 4,224,800 | — | 0.69% | $9.91B | — | — |
| 2025-12-15 | $16.45 | $16.89 | $16.21 | $16.47 | 5,596,000 | — | 0.91% | $10.08B | — | — |
| 2025-12-12 | $15.79 | $15.87 | $15.58 | $15.87 | 5,102,600 | — | 0.83% | $9.72B | — | — |
| 2025-12-11 | $15.91 | $16.00 | $15.36 | $15.60 | 11,203,400 | — | 1.83% | $9.55B | — | — |
| 2025-12-10 | $14.64 | $15.18 | $14.62 | $14.99 | 8,651,000 | — | 1.41% | $9.18B | — | — |
| 2025-12-09 | $14.54 | $14.81 | $14.45 | $14.51 | 5,969,000 | — | 0.97% | $8.88B | — | — |
| 2025-12-08 | $14.90 | $16.00 | $14.60 | $14.92 | 7,578,900 | — | 1.24% | $9.13B | — | — |
Close is split-adjusted to current shares. It is not dividend-adjusted: dividends are listed separately, so total return is (end price + dividends received − start price) ÷ start price, checkable by hand. Volume is as-traded.
Momentum: MACD and RSI
Top: MACD (navy) and its signal line (gold); bars show the gap between them, teal when MACD is above.
Bottom: RSI over 14 days; above 70 is usually read as overbought and below 30 as oversold.
The lines start late because MACD needs 26 trading days of prices and RSI 14 before the first value.
The colored strip under the charts shows the state label day by day; hover for the state and the reason.
Both measure momentum in the price and say nothing about value. Hover for each day's arithmetic.
Source: closing prices from this site's daily price archive (Yahoo Finance), not adjusted for dividends. Data through Nov 14, 2026.
How these are calculated
Short Selling
Bars: shares sold short each day in trades reported to FINRA (off-exchange
trades, roughly half of all volume).
Line: the short share of that volume, averaged over 20 sessions.
Gold points: short interest, the shares sold short and not yet bought back,
reported twice a month, also shown as a percentage of the free float and of
shares outstanding.
Daily short volume includes market makers' routine hedging, so a change in the
share is more informative than its level. Hover for each day's figures.
Sources: FINRA; float from this site's daily share records; shares outstanding
from the company's latest quarterly filing. Data through Nov 13, 2026.
Index-Fund Holdings
Daily positions of State Street's SPDR index funds, by the fund's file date.
These are the index funds whose daily holdings can be collected; iShares and
Vanguard funds, often larger holders, publish holdings that cannot be
collected automatically and appear in the written analysis from their
quarterly filings.
Collection began on October 11, 2026. A fund that drops the stock shows as an
exit.
Source: State Street Global Advisors. Data through
Nov 12, 2026.
Update — October 30, 2026: third-quarter trading update — HOLD, target €16.5 ($18.4) maintained
Written against the October 30, 2026 close of €17.70 in Amsterdam, with dollars at €1 = $1.1172, the European Central Bank’s reference rate for October 30, 2026. Source: the third-quarter 2026 trading update of October 29, 2026. The analysis below is left as published. This section tests the update against the three scenarios; the scenarios, weights and target are unchanged.
What the update said:
- Third quarter: revenue €2.51 billion, up 12.1%; organic growth +9.6%, of which volume +7.3% and price +2.2%. Acquisitions in India and Portugal added 2.6% and currencies took away 0.3%.
- By region: Europe and Australia +8.9%, the Americas +3.9%, Asia, the Middle East and Africa +17.6%. The company estimates that the extended European summer added 2–3 points to the quarter’s growth.
- Full year: organic growth raised to about 5.5%, from 3–5%. The adjusted EBITDA margin outlook is unchanged: +40 to 60 basis points on a comparable basis, 0 to 20 basis points as reported after the India acquisition.
- Other: the €500 million productivity program is on track; the first wave of the new technology systems starts in November 2026; the remaining transition services from Unilever end by the end of 2027.
- No share sale. A prospectus supplement filed the same day attaches the update to the existing resale registration for up to 121.6 million shares held by selling shareholders; it records no sale. 612,259,739 shares were outstanding at October 28, 2026.
Against the scenarios:
- Revenue is ahead of all three cases for 2026. Nine months of actual revenue and the guided fourth quarter give about €8.40 billion for 2026 (an estimate), against €8.24 billion in the base case and €8.30 billion in the best case.
- The fourth quarter is guided flat. Organic growth of 6.4% for the first nine months and about 5.5% for the year imply about +0.3% in the fourth quarter (−1% to +2% across 5.3–5.7%), so part of the third quarter’s strength was the weather, as the October 16, 2026 analysis expected.
- The margin, the question the rating turns on, is unchanged. The base case’s 16.0% for 2026 sits inside the reaffirmed guidance; the stall in 2027 that the weights allow for is neither confirmed nor ruled out.
- The value effect is small. Carrying the higher 2026 revenue into every later year raises the base case from €17.95 to €18.39 and the weighted value from €16.49 to about €16.91, under 3% (estimates). That is an upper bound, since it treats the weather as permanent.
| Case | Value, October 16, 2026 | With 2026 revenue at about €8.40 billion (an estimate) |
|---|---|---|
| Best | €23.88 | €24.24 |
| Base | €17.95 | €18.39 |
| Worst | €8.55 | €9.02 |
| Weighted 15 / 60 / 25 | €16.49 | €16.91 |
The rating stays HOLD and the target €16.5 ($18.4 at today’s rate). At €17.70 the expected return is about −7%, inside the HOLD band of −10% to +10%; the price would move into the TRIM band above about €18.3 ($20.5). The shares fell 2.1% on the release day and rose 4.3% on October 30, 2026. The next test is the full-year results in February 2027, with the first dividend and the 2027 margin guidance.
Update — October 16, 2026: the asymmetry, the money, the debt and where Magnum is — HOLD, target €17.1 → €16.5 ($18.5)
Written against the October 15, 2026 closes of €16.46 in Amsterdam and $18.44 on the NYSE. Euro values are shown with dollars at €1 = $1.1208, the European Central Bank’s reference rate for October 15, 2026; the header chips compare the dollar values of the cases with the NYSE price. Sources: the 2025 Form 20-F, the 2026 half-year results, the registration statement for the plants; the Dutch regulator’s (AFM) short-position and holdings registers; Circana, NOAA and European weather records; commodity prices; company and Unilever pages and news reports for the sites. The three scenarios of October 9, 2026 are unchanged. The analysis below is left as published; this section sets the scenario weights and adds stress tests, the money, the debt, the footprint, short interest and volatility. The rating is unchanged; the target moves from €17.1 to €16.5 because the weights change.
The one-line version
Magnum is priced for a stall in its margin plan, and the evidence does not yet say whether the stall will happen. Weighted 15% best, 60% base and 25% worst, it is worth about €16.5 ($18.5), almost exactly the price, and the price implies the same weights. The middle outcome decides it: with the margin stuck at 16% the shares are worth €15.1 ($17.0), and with volumes flat in Europe and the Americas, exactly the price. 2026 is a good year flattered by record heat, with costs falling for dairy and sugar; cocoa and energy are rising again for 2027. The debt is long and loose: €3.0 billion of fixed-rate bonds, nothing due before 2029 and no financial covenants.
How the money moves
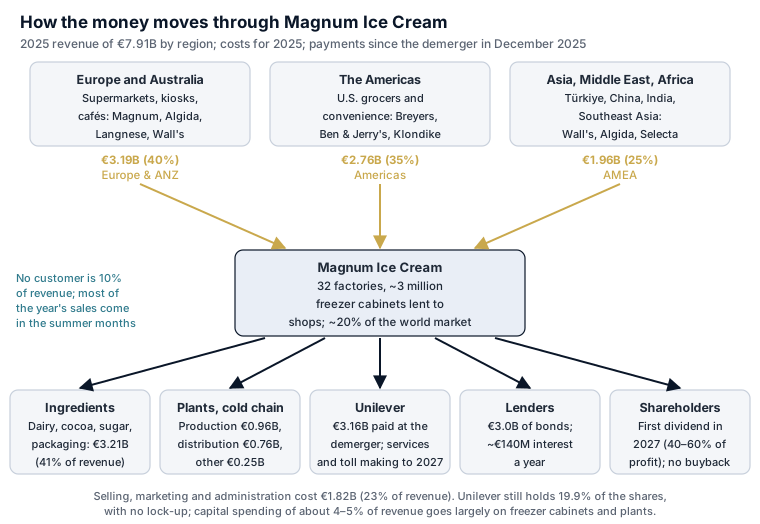
Who pays:
- By region, 2025 revenue was Europe and Australia €3.19 billion (40%), the Americas €2.76 billion (35%; the U.S. alone €2.07 billion) and Asia, the Middle East and Africa €1.96 billion (25%).
- No customer is 10% of revenue. Supermarkets such as Tesco, Carrefour and Costco, convenience chains such as 7-Eleven, and small shops supplied through about 3 million freezer cabinets that Magnum owns and lends.
- Growth has come from price in the Americas and from volume in Europe: in the first half of 2026 European volume rose 4.8% with prices slightly down, while volume in the Americas has been flat for six quarters and all of its growth has been price.
Where each €100 of revenue went, 2025, as a standalone company (2025 results, before separation costs, with standalone interest). Reported free cash flow for 2025 was only €38M, after €564M of separation outflows and a €231M working-capital build; in the first half of 2026 it was €273M. Management’s target is €0.8–1.0 billion a year from 2028, about €9–11 of each €100 on 2028 sales. Source: the 2025 Form 20-F and the 2026 half-year results; per-€100 figures are calculations.
About €6.90 of each €100 of revenue became free cash flow in 2025 as a standalone company, before separation costs (an estimate). Reported free cash flow was only €38 million after €564 million of separation payments; in the first half of 2026 it was €273 million. Management’s goal is €0.8–1.0 billion a year from 2028, about €9–11 of each €100.
The debt, tranche by tranche
The bonds were issued in November 2025 to repay Unilever’s separation loan.
| Tranche | Amount (€M) | Rate | Matures | Repaying early | Security | Notes |
|---|---|---|---|---|---|---|
| 2.75% notes | 750 | 2.750% fixed | February 2029 | Not filed | Senior unsecured; guaranteed by the parent and a Dutch holding company | |
| 3.25% notes | 750 | 3.250% fixed | November 2031 | Not filed | Senior unsecured; guaranteed | |
| 3.75% notes | 750 | 3.750% fixed | November 2034 | Not filed | Senior unsecured; guaranteed | |
| 4.00% notes | 750 | 4.000% fixed | November 2037 | Not filed | Senior unsecured; guaranteed | |
| Working-capital term loan | 190 | 1-month Euribor + 0.90% | About August 2028 | Repaid in full after June 30, 2026 | Unsecured; no covenants | Repaid |
| Commercial paper | 200 | Market rates | Short term | — | Unsecured; backed by the revolver | €150M after June 30, 2026 |
| Total drawn | 3,390 | ~3.4% (bonds fixed at 2.75–4.00%) | ||||
| Revolving credit | €1,000M (euro and dollar swinglines of €500M and $500M) | Euribor + 0.20–0.75% by rating | About August 2030, with two one-year extensions | Unsecured | Undrawn |
The four bonds were issued on November 26, 2025 under a new €8 billion programme to repay Unilever’s separation loan; the group paid Unilever €3.16 billion in cash. After June 30, 2026 the €190M term loan was repaid in full and commercial paper fell to €150M. Lease liabilities of €226M and the €133M put option held by the Philippine partner are not shown. Source: the 2025 Form 20-F and the 2026 half-year results, notes 4 and 7. As of June 30, 2026.
Principal due by year, including scheduled amortization. Nothing is due before February 2029; the bonds are spread evenly over nine years.
The base case repays the 2029 and 2031 bonds from its own cash; the worst case needs a small refinancing. Comparing the cash available by October 2031 with the two bonds due by then (estimates; dividends at half of adjusted profit from 2027):
| Base case | Worst case | |
|---|---|---|
| Free cash flow, July 2026–October 2031 | €3.08B ($3.45B) | €2.18B ($2.44B) |
| Dividends from 2027 at half of adjusted profit | − ~€1.68B ($1.88B) | − ~€1.31B ($1.46B) |
| Cash at June 30, 2026, less the term loan and paper repaid since | + ~€0.34B ($0.38B) | + ~€0.34B ($0.38B) |
| Available to repay debt | = ~€1.74B ($1.95B) | = ~€1.21B ($1.35B) |
| Bonds due February 2029 and November 2031 | − €1.50B ($1.68B) | − €1.50B ($1.68B) |
| Cash left after repaying them | = ~€0.24B ($0.27B) | = − ~€0.29B ($0.33B) (short) |
An investment-grade company would refinance a shortfall of that size easily; the risk is to the dividend more than to the lenders.
Interest expense
All the bonds are fixed, so interest is about €103 million a year in coupons (2.75%, 3.25%, 3.75% and 4.00% on €750 million each), plus commercial paper, bank fees and lease interest, for about €140 million in all (twice the first half of 2026). There are no interest-rate swaps. The first rate risk comes in February 2029: refinancing the 2.75% bond at 4.5% would add about €13 million a year, about €0.02 a share after tax.
| Covenant | Limit | Now | Room | Protects |
|---|---|---|---|---|
| Financial maintenance covenants | None: “The Group is not subject to financial covenants in any of its significant financing agreements.” | Net debt about 2.4 times adjusted EBITDA (company, end of 2025) | — | Bonds, term loans and revolver |
| Negative pledge and disposals | Customary negative pledge and limits on disposals in the bank facilities | No secured debt | — | Term loans and revolver |
| Change of control | No significant agreement changes on a takeover (the bond terms are not filed) | — | — | Bank facilities |
| Takeovers, mergers and buybacks (tax matters agreement with Unilever, not the debt) | U.S.: two years from the December 2025 demerger without a tax opinion or IRS ruling, and Magnum indemnifies Unilever if a takeover makes the demerger taxable; U.K.: no “chargeable payment” for five years | No buyback; shares bought only for incentive plans | U.S. restriction ends about December 2027; U.K. about December 2030 | Shares and M&A |
Rated BBB by S&P and Baa2 by Moody’s; the bank margins step with the ratings. Unilever’s 19.9% carries demand and piggyback registration rights and no lock-up.
Where Magnum is
Magnum makes ice cream close to where it is eaten, because frozen products are expensive to move. The 2025 20-F counts 30 factories (32 after buying the Indian and Portuguese businesses in 2026), 13 research centres, about 200 distribution centres and about 3 million freezer cabinets; the registration statement named 16 plants with their capacity, and the rest come from company and Unilever pages and news reports.
32 factories after the 2026 acquisitions in India and Portugal (12 in Europe and Australia, 8 in the Americas, 10 in Asia, the Middle East and Africa in 2025), 13 research centres, about 200 distribution centres and about 3 million freezer cabinets. 24 of the 30 factories still make some products for Unilever under transition agreements; the key plants run at about 70% of capacity. Click a point for details. Map data © OpenStreetMap contributors. Source: the registration statement (plants and capacity), the 2025 Form 20-F (counts by region) and, for the other sites, company and Unilever pages and news reports; coordinates from OpenStreetMap. As of October 16, 2026.
Europe and Türkiye: Heppenheim (Germany) is the largest European plant and has added a Ben & Jerry’s line; Çorlu and Konya serve Türkiye, where a 2026 ruling requires a share of freezer space to be opened to competitors. Click a point for details. Map data © OpenStreetMap contributors. Source: the registration statement (plants and capacity), the 2025 Form 20-F (counts by region) and, for the other sites, company and Unilever pages and news reports; coordinates from OpenStreetMap. As of October 16, 2026.
The Americas: the two largest plants in the group are in Sikeston, Missouri and Covington, Tennessee; Ben & Jerry’s is made in Vermont; the Mexican plant still belongs to Unilever and makes for Magnum under a co-packing agreement until it transfers. Click a point for details. Map data © OpenStreetMap contributors. Source: the registration statement (plants and capacity), the 2025 Form 20-F (counts by region) and, for the other sites, company and Unilever pages and news reports; coordinates from OpenStreetMap. As of October 16, 2026.
- The largest plants are in the U.S.: Sikeston, Missouri (239 million litres a year) and Covington, Tennessee (217 million). Ben & Jerry’s is made in Vermont and, for Europe, in Hellendoorn in the Netherlands, with a new line at Heppenheim, Germany.
- Europe’s biggest plants are Heppenheim (186 million litres), Caivano in Italy (164 million) and Banino in Poland (134 million); Türkiye has two large plants, Çorlu and Konya, and 86 cold stores.
- Asia has plants in Taicang (China), Pasig (Philippines, a joint venture), Cikarang (Indonesia), Minburi (Thailand), Lahore (Pakistan) and, since 2026, Nashik and Nalagarh in India.
- Unilever still runs much of it. 24 of the 30 factories still make some products for Unilever under transition agreements, the Mexican plant still belongs to Unilever, and the key plants run at about 70% of capacity. About 19,000 people work for Magnum.
The scenarios and the asymmetry
The three cases are the ones built on October 9, 2026, in euros: best €23.88 ($26.76) (organic growth of 4.5%, 3.5% and 9% in Europe, the Americas and AMEA, and the margin rising 60 basis points a year), base €17.95 ($20.12) (3.5%, 2% and 7.5%, and 40 basis points a year) and worst €8.55 ($9.58) (1%, −1% and 4.5%, and the margin falling 20 basis points a year), against €16.46 ($18.44): +45%, +9% and −48%.
Stress tests on the base case, one change at a time (estimates):
| Change | Value | vs price |
|---|---|---|
| Worst-case growth with the base margin path | €11.47 ($12.86) | −30% |
| Margin flat at 16% (no expansion) | €15.14 ($16.97) | −8% |
| Discount rate 8.5% | €15.97 ($17.90) | −3% |
| Volumes flat in Europe and the Americas (growth from price only) | €16.45 ($18.44) | 0% |
| Margin up 20 basis points a year (half the plan) | €16.54 ($18.54) | +1% |
| AMEA currency losses of 5% a year (not 3%) | €17.30 ($19.39) | +5% |
| Discount rate 7.5% | €20.32 ($22.77) | +23% |
| Margin reaching 20% by 2030, the chief executive’s aspiration | €20.76 ($23.27) | +26% |
The margin path matters most, and the price sits on the flat-volume line. The evidence on each side:
- For the plan: the €500 million productivity programme is on track (€90 million in the first half of 2026); the transition costs end in 2027; dairy prices are 30–44% lower than a year ago and sugar is near a five-year low; in the first half of 2026 the operating margin rose 50 basis points, and the EBITDA margin about 70 basis points before the transition costs and the Indian acquisition.
- Against it: 2026 is flattered by the hottest U.S. summer on record and record European heat, so 2027 faces a hard comparison; cocoa has doubled since February and energy is up; volume in the Americas has been flat for six quarters; GLP-1 weight-loss drugs reduce ice-cream purchases in user households; Türkiye now requires a share of freezer space to be opened to competitors.
- Around the shares: short sellers have covered (about 19% of the free float was on loan in April 2026; disclosed positions are now about 1%); Trian Fund Management, an activist, holds 3.7%; a private-equity approach was reported in May 2026, and the tax agreement with Unilever deters a takeover until about December 2027; Unilever’s 19.9% is unsold.
Three weightings, and what the price implies. The standard set, 25 / 50 / 25, and the stress set, 10 / 40 / 50, are the same for every company; the best guess drives the target and the two chips at the top of the page.
| Weights, best / base / worst | Value | Expected return | Gain to loss |
|---|---|---|---|
| Standard: 25 / 50 / 25 | €17.08 ($19.14) | +4% | 1.3 to 1 |
| Best guess: 15 / 60 / 25 | €16.49 ($18.48) | 0% | 1.0 to 1 |
| Stress: 10 / 40 / 50 | €13.84 ($15.51) | −16% | 0.3 to 1 |
| What the price implies: 15 / 60 / 25 | €16.46 ($18.44) | 0% | 1.0 to 1 |
The weights are a judgement. All values are estimates from the model.
Why the best guess. The best case needs the top of guidance on growth and margin every year, and this year’s growth is helped by the weather, so it gets 15%. The full worst case, a sustained decline, is unlikely on its own, but a stalled margin, perhaps a one-in-four outcome worth €15.1, sits about a third of the way toward it, and cocoa, energy and GLP-1 drugs all point that way for 2027; so the worst case gets 25%. The base case takes 60%. Evidence that would move the weights: a third-quarter update showing 2026 at the top of the comparable margin guidance of +40–60 basis points, with a confident view of 2027 costs (best case up); a cautious 2027 cost outlook or a second half of falling volume in the Americas (worst case up).
What the price implies. Holding the base case at its 60% weight, the price is matched by the weighting that solves
best weight × $26.76 + 60% × $20.12 + (40% − best weight) × $9.58 = $18.44
which gives a best-case weight of ($18.44 − $12.07 − $3.83) ÷ ($26.76 − $9.58) = 15%, and so 25% on the worst case: the market’s weights and the best guess coincide.
The asymmetry on the best guess (in dollars, as the chips use):
| Measure | At $18.44 | What it means |
|---|---|---|
| Expected return (header chip) | 0% | The probability-weighted value, $18.48 (€16.49), against the price |
| Gain to loss (header chip) | 1.0 to 1 | +$2.26 of probability-weighted gain against −$2.22 of loss |
| Expected base-case gain ÷ expected worst-case loss | 0.46 to 1 | +$1.01 against −$2.22 |
| Best-case gain ÷ worst-case loss | 0.94 to 1 | +$8.32 against −$8.86 |
| Base-case gain ÷ worst-case loss | 0.19 to 1 | +$1.68 against −$8.86 |
How the measures are calculated. Gain = case value − price; loss = price − case value. Weights are the best guess: 15% best, 60% base, 25% worst.
| Measure | Formula | At $18.44 |
|---|---|---|
| Expected return | (15% × best + 60% × base + 25% × worst) ÷ price − 1 | ($4.01 + $12.07 + $2.40) ÷ $18.44 − 1 = 0% |
| Gain to loss | (15% × best gain + 60% × base gain) ÷ (25% × worst loss) | ($1.25 + $1.01) ÷ $2.22 = 1.02 |
| Price-implied best weight | (price − base weight × base − (1 − base weight) × worst) ÷ (best − worst) | ($18.44 − $12.07 − $3.83) ÷ $17.18 = 15% |
The header chips are green at +25% or more and 3 to 1 or better, blue at +10–25% and 2–3 to 1, orange at 0–10% and 1–2 to 1, and red below zero and below 1 to 1. On the best guess, expected return is green below $14.78 (€13.19), blue up to $16.80 (€14.99) and orange up to $18.48 (€16.49); gain to loss is green below $15.51 (€13.84), blue up to $16.70 (€14.90) and orange up to $18.48. Both are red above $18.48 (€16.49).
Short interest and volatility
The tables below show how much of the stock is sold short and how much the price moves. They are inputs to the weights above, and the tables update with the nightly data.
| Report | Settled | Short | % float | % outst. | Days to cover |
|---|---|---|---|---|---|
| First after the spin | Dec 15, 2025 | 4.19M | 0.9% | 0.7% | 1.0 |
| Lowest since the spin | Jan 15, 2026 | 2.25M | 0.5% | 0.4% | 1.6 |
| Three months earlier | Jul 15, 2026 | 11.39M | 2.3% | 1.9% | 8.4 |
| At the valuation | Oct 15, 2026 | 7.73M | 1.6% | 1.3% | 8.6 |
| Latest | Oct 30, 2026 | 7.63M | 1.6% | 1.2% | 8.9 |
The latest share of float is higher than 7 of the 21 earlier reports since the spin. Short interest in shares, with its share of the float and of shares outstanding. FINRA settlement dates; figures are published about eight business days later. Days to cover is short interest divided by average daily volume, as reported by FINRA. Float and shares outstanding on or before each date, from this site's daily share records and the company's filings.
These figures cover only U.S. trading, a small part of the volume, most of which is in Amsterdam: FINRA’s 9.3 million shares short is about 1.9% of the float, and its 12.8 days to cover reflects thin NYSE volume. The Dutch regulator’s register is the better guide for the whole market: disclosed net short positions are now about 1.1% of the shares (Ilex Capital and CFM), against a peak of 1.6% for Marshall Wace alone in March 2026, and S&P Global estimated that about 19% of the free float was on loan in April 2026. The short sellers have largely closed.
| Volatility, annualized | Last 20 sessions | Last 60 sessions | Since the spin |
|---|---|---|---|
| To November 13, 2026 | 36% | 31% | 43% |
At the last 60 sessions' volatility, one standard deviation over a month is about ±9%, or $18.18 to $21.78 from the $19.90 close; about two months in three end inside that range if volatility holds. The median daily move since the spin is 1.3%.
| Results day | Released | Close before | Close after | Move | Times a median day |
|---|---|---|---|---|---|
| February 12, 2026 | Before the open | $19.87 | $16.31 | -17.9% | 13.5× |
| April 30, 2026 | Before the open | $13.06 | $14.93 | +14.3% | 10.8× |
| July 30, 2026 | Before the open | $18.24 | $18.74 | +2.7% | 2.1× |
Average move on a results day: 11.7% either way, against a median day's 1.3%. The move is measured from the close before the release to the close of the first session after it.
Results days have moved the stock a lot: −17.9% on the 2025 results in February 2026, +14.3% on the first-quarter update and +2.7% on the half year, against a median day’s 1.3%. The third-quarter trading update, expected around October 29–30, 2026 (not yet confirmed), faces the toughest comparison of the year but follows a record summer.
Notes on earlier sections
The free-cash-flow goal. The October 9, 2026 analysis described management’s goal as €0.8–1.0 billion of free cash flow “in 2028 and 2029”. The 2025 20-F says “€0.8 to 1.0 billion of free cash flow from 2028”, a level to be held from 2028 on. The point that the goal sits above all three cases is unchanged. A clarification.
What it means for the rating
HOLD, target €17.1 → €16.5 ($18.5). The target is the best-guess value, €16.49 ($18.48); the October 9, 2026 target used the standard weights. Both chips are orange at $18.44, with an expected return of about 0% and gain to loss about 1 to 1: the price matches the weights the evidence supports. The upside depends on the margin plan, which the third-quarter update and the 2027 cost outlook will test first.
| Action | Level | Reason |
|---|---|---|
| Accumulate | Below about €15.0 ($16.80) | Expected return above 10% and gain to loss two to one |
| Hold | €15.0–18.0 ($16.80–20.20) | |
| Trim | Above €18.0 ($20.20) | The base case |
| Move to ACCUMULATE | The margin at the top of guidance with a confident 2027 cost outlook, or a clean placement of Unilever’s stake | |
| Move to SELL | Volume falling for a second half-year, or the 2026 comparable margin below the guided +40 basis points |
The table of what the third-quarter update must show, in the October 9, 2026 analysis below, stands, with one addition: management’s first view of 2027 input costs.
Post-Spin Analysis — October 9, 2026
Written against the October 8, 2026 close of €15.45 in Amsterdam ($17.44 on the NYSE, where the same ordinary shares trade in dollars). Per-share euro values are shown with dollars at €1 = $1.1206, the rate on the date of writing; the sensitivity grids give both, and prices of past share purchases are left in euros. Primary sources: the 2025 annual report on Form 20-F, the 2025 full-year results, the first-quarter trading update, the 2026 half-year results, the Form 20-F registration statement and the resale prospectus for Unilever’s stake; the company’s notices of directors’ dealings and own-share purchases; the Dutch regulator’s (AFM) substantial-holding and net-short registers; FTSE Russell, MSCI, STOXX and Euronext index notices; FINRA short-interest data; and the chief executive’s remarks at Barclays’ consumer staples conference on September 8, 2026 (transcript). The company reports in euros under IFRS, and the valuation is in euros. Forecasts and scenario values are estimates.
The one-line version
Magnum is the world’s largest ice cream company, with about a fifth of the global market, twice the share of Froneri, and a network of three million freezer cabinets. It came out of Unilever with €3 billion of debt, a margin that fell a point in its first year, and its former parent still holding 19.9% with no lock-up. The shares fell 32% from February to April 2026 on weak results, fears about weight-loss drugs and a short position of nearly a fifth of the free float, then rose 58% to August 2026 on better trading, a reported private-equity approach and a good European summer.
Built line by line, the business is worth €18.0 ($20.1) a share in the base case, €23.9 ($26.8) in the best and €8.6 ($9.6) in the worst; weighted, €17.1 ($19.14), 11% above the price. The value depends mostly on whether the margin rises from 16% toward the 20% management is aiming for. The price sits at the level where expected gain is twice expected loss, and Unilever’s stake is still to be sold.
Rating: HOLD · Target €17.1 ($19.15) · Accumulate below €15.40 ($17.25) · Grade: A- (3.68)
What the business actually is
Magnum makes and sells ice cream in about 80 countries through four global brands, the Heartbrand (Wall’s, Algida, Carte d’Or, Solero), Magnum, Ben & Jerry’s and Cornetto, which are four of the world’s five largest ice cream brands, alongside Breyers, Klondike, Talenti, Yasso and Popsicle. More than 90% of revenue comes from brands it owns. It reports three regions:
| Region | 2025 revenue | Adjusted EBITDA | Margin | Organic growth 2025 | H1 2026 margin |
|---|---|---|---|---|---|
| Europe & ANZ | €3,192M | €419M | 13.1% | +3.3% | 17.7% |
| Americas | €2,757M | €388M | 14.1% | +0.8% | 16.0% |
| AMEA (Asia, Middle East, Turkey, Africa, Latin America) | €1,961M | €448M | 22.9% | +10.9% | 23.5% |
| Group | €7,910M | €1,255M | 15.9% | +4.2% | 18.7% |
The business is seasonal: 47% of revenue falls in May to August 2026, and half-year margins are far above full-year margins (18.7% in the first half of 2026, about 12% in the second half of 2025). The United States is the largest country, at €2.1 billion of revenue; Turkey, where Magnum has more than 80% of the market, is about €650 million. An estimated 60% of revenue is sold in supermarkets for eating at home and the rest through cafés, kiosks and corner shops, where Magnum owns the freezer; the company does not disclose the group split, and the estimate is built from its regional descriptions. In 2026 it bought Unilever’s listed Indian ice cream business (Kwality Wall’s, €279 million for 61.9%) and the Portuguese business (€149 million).
Management Team
| Role | Name | Background |
|---|---|---|
| Chief executive | Peter ter Kulve | More than 35 years at Unilever; ran the ice cream business group from 2024; earlier president of Home Care |
| Chief financial officer | Abhijit Bhattacharya | About ten years as chief financial officer of Philips; earlier chief operating and financial officer of ST-Ericsson |
| Regional presidents | Mustafa Seckin (Europe & ANZ), Gerardo Rozanski (Americas), Toloy Tanridagli (Middle East, Turkey, South Asia, Africa), Wai-Fung Loh (Asia) | Unilever ice cream and foods executives |
| Other executives | Sandeep Desai (supply chain), Mark O’Brien (technology, ex-PepsiCo and Reckitt), Ronald Schellekens (people, ex-PepsiCo and Vodafone), Vanessa Vilar (legal), Julien Barraux (creative), Tim Gunning (strategy) |
The chief executive ran this business inside Unilever, and the team below him is largely the one that ran it there. Pay is weighted heavily to shares: the chief executive’s base salary is €1.25 million, his annual bonus target 120% of salary on growth, market share, margin and free cash flow, and his performance shares 180% of salary on organic growth and earnings per share. A one-off Foundation Plan let executives buy shares worth up to five times salary and receive five options for each share bought, vesting only if total shareholder return beats the median of a peer group; the chief executive holds 2.36 million options at €15.33. The plan passed with 77.4% of votes, and the company issued an update statement because more than 20% voted against.
Management has bought heavily. Executives and directors bought about €21.7 million of shares in the open market, mostly in December 2025 at €12.67–13.80 and in late May and June 2026 as the Foundation Plan’s co-investment. The chief executive alone bought about €6.3 million and the chief financial officer about €3.8 million. The only open-market sales were two of under 2,000 shares each.
The board
Jean-François van Boxmeer, Heineken’s chief executive for fifteen years and later chair of Vodafone, chairs the board. The independent directors include Stacey Cartwright (senior independent director), René Hooft Graafland (audit, a former Heineken chief financial officer), Melissa Bethell (remuneration, formerly of Bain Capital), Stefan Bomhard (former chief executive of Imperial Brands) and Anja Mutsaers. Unilever has one seat (Reginaldo Ecclissato). Josh Frank of Trian Fund Management joined in March 2026; Trian holds about 3.7%.
The financial record — three years by region
From the 20-F and the half-year results, in euro millions.
| 2023 | 2024 | 2025 | H1 2025 | H1 2026 | |
|---|---|---|---|---|---|
| Revenue | 7,618 | 7,947 | 7,910 | 4,503 | 4,691 |
| Organic growth | +2.5% | about +2.8% | +4.2% | +5.8% | +4.7% |
| of which volume | about −7% | +1.1% | +1.5% | +3.5% | +2.5% |
| of which price | about +10% | +1.7% | +2.6% | +2.1% | +2.2% |
| Adjusted EBITDA | 1,211 | 1,340 | 1,255 | 853 | 880 |
| margin | 15.9% | 16.9% | 15.9% | 19.0% | 18.7% |
| Operating profit | 742 | 764 | 599 | 569 | 587 |
| Free cash flow | 652 | 803 | 38 | 138 | 273 |
| Net debt | — | 263 | 2,967 | — | 3,264 |
Three things the record shows.
Growth has come from price more than volume. In 2023 the company raised prices about 10% to cover a jump in cocoa, dairy and energy costs and lost about 7% of volume. Volume has grown only 1–2% a year since, and 2.5% in the first half of 2026, against 3.5% in the first half of 2025.
The margin fell a point in the year of the separation. Adjusted EBITDA margin was 16.9% in 2024 and 15.9% in 2025: cost inflation of 3.8 points, mostly cocoa, outran pricing and savings, and the services Magnum now buys from Unilever under transitional agreements cost cash where Unilever used to allocate depreciation, about half a point of margin. That second effect means 2025 and 2026 margins are not measured on the same basis as 2023 and 2024.
The adjusted figures exclude large recurring charges. Adjusting items were €200 million in 2024, €318 million in 2025 and €129 million in the first half of 2026, mostly separation and restructuring. The separation part ends with the transitional agreements in 2027; restructuring has recurred every year.
The 2025 free cash flow of €38 million is a separation year, after €564 million of separation cash outflows. Before 2025 the business carried almost no interest, because Unilever funded it; it now pays about €160 million a year.
The separation: €3 billion of debt and a fifth of the shares still to sell
Unilever transferred the ice cream business to Magnum in exchange for an intercompany loan, which Magnum refinanced with €3 billion of bonds issued in November 2025 at 2.75–4% and maturing between 2029 and 2037. Net debt was €3.26 billion at June 30, 2026, about 2.5 times EBITDA, against a target of 2.0–2.5 times and ratings of BBB and Baa2. There are no financial covenants.
Three features of the separation carry forward:
- Unilever’s 19.9%. Unilever kept 121.6 million shares, has registered all of them for resale, is not bound by any lock-up, and says it will sell them “in an orderly and considered manner” within five years to pay for the separation. It has not sold any so far. At €15.45 ($17.31) the stake is worth about €1.9 billion, about 57 days of trading on the three main exchanges at the September 2026 pace.
- The transitional agreements. Unilever still provides services in many countries, at a cost of €106 million in the second half of 2025, and the company expects to leave them by the end of 2027. Several working-capital balances with Unilever (a €905 million inventory subsidy Magnum paid, a €300 million subsidy it received and an €818 million accrual for inventory Unilever still owns) settle when the agreements end; their net cash effect is not determinable from the disclosures.
- A two-year US tax restriction. The demerger was tax-free in the United States on conditions that restrict mergers, acquisitions and buybacks until about December 2027 without a tax opinion or ruling, and Magnum indemnifies Unilever if its own actions, explicitly including a takeover of Magnum, cause the tax-free treatment to fail.
Under the demerger agreement, liabilities of the ice cream business stay with Magnum whenever they arise. The pension plans showed a small net surplus at the end of 2025.
Margins are the case: 16% now, 20% the aim
The chief executive put it directly in September 2026: “We do 16% EBITDA, we strive to do 20%,” and called the 2025 margins “a little bit of a disappointment”. The company’s medium-term aim is a margin rising 40–60 basis points a year on average. For 2026 it guides to that improvement on a like-for-like basis, which becomes only 0–20 basis points reported because the Indian business it bought earns less.
What should lift the margin:
- A €500 million productivity program over the medium term (€350–380 million in supply chain), of which €150 million was delivered in the eighteen months before the 2025 capital markets day and €90 million in the first half of 2026.
- The end of the transitional agreements by 2027, removing double-running costs.
- Cocoa, which the chief executive described as a 350–400 basis point cost now “flowing back”, although cocoa futures roughly doubled again between April and August 2026.
What works against it:
- Turkey. From August 15, 2026, an interim order of the Turkish competition authority requires Magnum to give up 30% of its freezer space in small shops to rivals or leave it empty, in a market where it has more than 80% share.
- India, where the company is cutting prices 30%, adding 70,000 cabinets a year and building five factories, so losses rise by design for now.
- The United States, where large tubs, Breyers’ format, are shrinking 2% a year while handhelds and pints grow.
Volumes and the weight-loss-drug question
The bear case on the stock in the spring was volume: that GLP-1 weight-loss drugs would shrink demand for treats. BNP Paribas Exane downgraded on it in April 2026, and 19% of the free float was reported on loan. The company’s evidence so far runs the other way: volume grew 2.9% in the first quarter and 2.5% in the first half, above the 1.1% and 1.5% of the last two full years, and the chief executive cited data showing GLP-1 users index at 115 against 100 for non-users on handheld ice cream. The market itself is growing 3–4% a year, faster in emerging markets. It is too early to settle, and it is the single largest question for the worst case below.
Capital allocation
The first dividend will be for 2026, paid in the first half of 2027, at 40–60% of adjusted net income, which on the base case below is €0.37–0.56 ($0.41–0.63) a share, a yield of 2.4–3.6%. Leverage is to stay at 2.0–2.5 times with a solid investment-grade rating, capital spending rises to about 5% of sales over the medium term (net €330 million, 4.2%, in 2025) for cabinets and capacity, and bolt-on acquisitions are allowed. There is no buyback for capital return; the company has bought 8.45 million shares since August 18, 2026 (about €143 million) to cover incentive plans, which does not reduce the share count. The chief executive said that once free cash flow exceeds €1 billion, about half would go to dividends and half to investment and acquisitions.
Valuation
Three scenarios, built line by line
Each region grows on its own organic rate, with translation losses on AMEA’s currencies (the Turkish lira above all); the group margin starts at the 2026 guidance and moves by a set amount each year; growth fades to a long-run rate after 2030. Below EBITDA: depreciation 4.3% of sales, net finance costs of €160 million, a 27% tax rate, minorities of €15 million, capital spending of 5% of sales to 2029 and 4.5% after, working capital at 10% of each euro of growth, and separation and restructuring cash of €250–300 million in 2026 falling away by 2028.
| Driver | Best | Base | Worst |
|---|---|---|---|
| Organic growth a year: Europe & ANZ / Americas / AMEA | 4.5% / 3.5% / 9% | 3.5% / 2% / 7.5% | 1% / −1% / 4.5% |
| Translation loss on AMEA a year | 2% | 3% | 5% |
| 2026 EBITDA margin | 16.1% | 16.0% | 15.7% |
| Margin change a year to 2030 | +60bp | +40bp | −20bp, floor 15% |
| Long-run growth after 2030 | 3.0% | 2.5% | 1.5% |
| € millions | 2025 | 2026E | 2027E | 2028E | 2029E | 2030E |
|---|---|---|---|---|---|---|
| Base — Europe & ANZ | 3,192 | 3,365 | 3,483 | 3,605 | 3,731 | 3,862 |
| Americas | 2,757 | 2,754 | 2,809 | 2,865 | 2,922 | 2,981 |
| AMEA | 1,961 | 2,125 | 2,220 | 2,320 | 2,425 | 2,534 |
| Revenue | 7,910 | 8,244 | 8,512 | 8,790 | 9,078 | 9,376 |
| Adjusted EBITDA | 1,255 | 1,319 | 1,396 | 1,477 | 1,561 | 1,650 |
| Margin | 15.9% | 16.0% | 16.4% | 16.8% | 17.2% | 17.6% |
| Adjusted EPS | €0.93 ($1.04) | €0.93 ($1.04) | €1.01 ($1.13) | €1.09 ($1.22) | €1.17 ($1.31) | €1.26 ($1.41) |
| IFRS EPS | €0.48 ($0.54) | €0.60 ($0.67) | €0.86 ($0.96) | €1.04 ($1.17) | €1.15 ($1.29) | €1.24 ($1.39) |
| Free cash flow | 38 | 333 | 461 | 567 | 631 | 730 |
| Best — revenue | 8,296 | 8,695 | 9,115 | 9,557 | 10,022 | |
| Adjusted EBITDA (margin) | 1,336 | 1,452 | 1,577 | 1,711 | 1,854 (18.5%) | |
| Free cash flow | 360 | 511 | 628 | 706 | 841 | |
| Worst — revenue | 8,132 | 8,128 | 8,124 | 8,122 | 8,119 | |
| Adjusted EBITDA (margin) | 1,277 | 1,260 | 1,243 | 1,226 | 1,218 (15.0%) | |
| Free cash flow | 302 | 382 | 421 | 452 | 487 |
The company’s free cash flow target is above all three cases. Management aims for €0.8–1.0 billion in 2028 and 2029; the base case reaches €567–631 million and the best case €628–706 million. With capital spending at the 5% guided, reaching the target needs a margin near 19–20% by 2028, which is the chief executive’s aim rather than the 40–60 basis points a year guided. This is the gap most worth testing in 2027.
The value, by scenario
Free cash flow before interest from 2027 to 2035, discounted at 8%, a rate for an investment-grade euro consumer business with a cyclical input-cost exposure, with a terminal value growing at each case’s long-run rate, less net debt of €3.26 billion, on 617 million diluted shares.
| Scenario | Per share (€) | Per share ($) | vs €15.45 | Weight |
|---|---|---|---|---|
| Best | €23.9 | $26.8 | +55% | 25% |
| Base | €18.0 | $20.1 | +16% | 50% |
| Worst | €8.6 | $9.6 | −45% | 25% |
| Probability-weighted | €17.1 | $19.1 | +11% |
| Discount rate | Best | Base | Worst | Weighted |
|---|---|---|---|---|
| 7.5% | €27.2 ($30.5) | €20.3 ($22.7) | €9.7 ($10.9) | €19.4 ($21.7) |
| 8.0% | €23.9 ($26.8) | €18.0 ($20.1) | €8.6 ($9.6) | €17.1 ($19.1) |
| 8.5% | €21.2 ($23.8) | €16.0 ($17.9) | €7.6 ($8.5) | €15.2 ($17.0) |
The 25 / 50 / 25 weights are a judgement. Other weightings give €16.3–17.9 ($18.3–20.1):
| Weights, best / base / worst | Per share |
|---|---|
| 30 / 50 / 20 | €17.9 ($20.1) |
| 25 / 50 / 25 (the target) | €17.1 ($19.1) |
| 20 / 60 / 20 | €17.3 ($19.4) |
| 15 / 70 / 15 | €17.4 ($19.5) |
| 10 / 80 / 10 | €17.6 ($19.7) |
| 20 / 50 / 30 | €16.3 ($18.3) |
What the best case requires: organic growth at the top of the company’s 3–5% range with AMEA near 9%, and the margin rising 60 basis points a year to 18.5% by 2030, the top of management’s guide and short of the 20% aim. The productivity program, cocoa costs easing and the end of the transitional agreements together make that possible.
What the worst case requires: volume losses in the Americas, growth near zero in Europe, Turkey’s cabinet order cutting AMEA growth and spreading to other markets, and the margin slipping to 15% as cost inflation outruns pricing, which is what happened in 2025. Weight-loss drugs reducing treat consumption are the plausible cause.
Which assumption matters most, one at a time in the base case:
| Change | Per share | Change |
|---|---|---|
| No margin improvement after 2026 | €15.1 ($16.9) | −€2.8 (−$3.1) |
| Margin +60bp a year (top of the guide) | €19.4 ($21.7) | +€1.4 (+$1.6) |
| Long-run growth 3.0% / 2.0% | €19.7 ($22.1) / €16.5 ($18.5) | +€1.7 (+$1.9) / −€1.5 (−$1.7) |
| AMEA growth 2.5 points lower (Turkey) | €17.2 ($19.3) | −€0.8 (−$0.9) |
| Americas growth 2 points lower | €17.2 ($19.3) | −€0.8 (−$0.9) |
| AMEA currency loss 5% a year, not 3% | €17.3 ($19.4) | −€0.6 (−$0.7) |
| Europe & ANZ growth 1 point higher | €18.5 ($20.7) | +€0.5 (+$0.6) |
The margin is the case. Without any improvement after 2026 the value falls to roughly today’s price; each region’s growth matters less than a few tenths of a point of margin a year.
The asymmetry is close to balanced. The best case is €8.4 ($9.4) above the price and the worst €6.9 ($7.7) below it; the probability-weighted ratio of expected gain to expected loss is 1.95, and €15.38 ($17.23) is the price at which it reaches two to one. With the best case at 25%, the price implies about a 42% chance of the worst case: the market is still pricing much of the spring’s bear case.
How sensitive the discounted cash flow is
The terminal value is 64% of the base-case enterprise value, and it implies a terminal multiple of 9.7 times EBITDA, about where the shares trade today. The two inputs that matter most are the discount rate with long-run growth, and the margin path. Base case, per share in euros with dollars in brackets:
| Discount rate ↓ / long-run growth → | 1.5% | 2.0% | 2.5% | 3.0% | 3.5% |
|---|---|---|---|---|---|
| 7.0% | €19.47 ($21.82) | €21.16 ($23.71) | €23.22 ($26.02) | €25.80 ($28.91) | €29.11 ($32.62) |
| 7.5% | €17.34 ($19.43) | €18.70 ($20.96) | €20.32 ($22.77) | €22.31 ($25.00) | €24.79 ($27.78) |
| 8.0% | €15.54 ($17.41) | €16.64 ($18.65) | €17.95 ($20.11) | €19.51 ($21.86) | €21.43 ($24.01) |
| 8.5% | €14.00 ($15.69) | €14.91 ($16.71) | €15.97 ($17.90) | €17.23 ($19.31) | €18.74 ($21.00) |
| 9.0% | €12.66 ($14.19) | €13.42 ($15.04) | €14.30 ($16.02) | €15.33 ($17.18) | €16.54 ($18.53) |
| 2030 EBITDA margin ↓ / discount rate → | 7.0% | 7.5% | 8.0% | 8.5% | 9.0% |
|---|---|---|---|---|---|
| 16.0% (no improvement) | €19.74 ($22.12) | €17.21 ($19.29) | €15.14 ($16.97) | €13.41 ($15.03) | €11.96 ($13.40) |
| 16.8% | €21.48 ($24.07) | €18.76 ($21.02) | €16.54 ($18.53) | €14.69 ($16.46) | €13.13 ($14.71) |
| 17.6% (base) | €23.22 ($26.02) | €20.32 ($22.77) | €17.95 ($20.11) | €15.97 ($17.90) | €14.30 ($16.02) |
| 18.4% | €24.96 ($27.97) | €21.88 ($24.52) | €19.35 ($21.68) | €17.25 ($19.33) | €15.47 ($17.34) |
| 19.2% | €26.70 ($29.92) | €23.43 ($26.26) | €20.76 ($23.26) | €18.53 ($20.76) | €16.64 ($18.65) |
| 20.0% (the chief executive’s aim) | €28.44 ($31.87) | €24.99 ($28.00) | €22.16 ($24.83) | €19.81 ($22.20) | €17.82 ($19.97) |
Each half point on the discount rate is worth about €2 ($2.2) a share and each half point of long-run growth about €1.5 ($1.7). Each 0.8 point of 2030 margin is worth about €1.4 ($1.6), and the full move to 20% is worth €4.2 ($4.7) at 8%. The price of €15.45 ($17.31) is close to the base case at an 8.5% discount rate, or to no margin improvement at 8%.
Earnings and multiples
| At €15.45 ($17.31) | |
|---|---|
| Market capitalization (617M diluted shares) | €9.5B |
| Enterprise value | €12.8B |
| EV / 2026E EBITDA | 9.7× |
| EV / 2027E EBITDA | 9.2× |
| Price / 2026E adjusted EPS | 16.7× |
| Price / 2027E adjusted EPS | 15.4× |
| Free cash flow yield, 2027E | 4.8% |
| Dividend yield at a 40–60% payout on 2026E | 2.4–3.6% |
How these compare with listed food companies and with Froneri’s valuation is set out under In depth: valuation against peers below.
What this most resembles
The closest cases on this site are consumer and food separations, and those where the parent kept a stake to sell. Returns are measured from each company’s first-day price, and the last return column is the compound annual return from the first day to today.
| Spinoff | Parent | First day | What it shares with Magnum | First year | Two years | Since the spin, a year | Outcome |
|---|---|---|---|---|---|---|---|
| Haleon | GSK | Jul 2022 | Consumer brands; parents’ retained stakes (GSK, Pfizer) sold over time; London and New York listings | +20.7% | +25.8% | +7.5% | Stakes sold through placements and buybacks by 2025 |
| Solventum | 3M | Apr 2024 | Parent kept 19.9% to sell within five years, the same structure as Unilever’s | +10.5% | −6.9% | +9.3% | |
| Sandoz | Novartis | Oct 2023 | European company listed at home, also traded in New York; a business the parent had under-managed | +55.5% | +124.9% | +47.9% | Re-rated as a standalone |
| BellRing Brands | Post | Mar 2022 | Packaged food with a retained parent stake | +21.8% | +143.8% | −21.7% | Now 67% below its first-day price |
| Lamb Weston | Conagra | Nov 2016 | Category leader in a concentrated food category with few global competitors | +73.8% | +175.4% | +7.1% | |
| Post Holdings | Ralcorp | Feb 2012 | Branded packaged food | +40.9% | +100.9% | +10.3% | |
| Mondelez (then Kraft Foods) | Altria | Apr 2007 | Global snacks and confectionery, with cocoa exposure | +6.2% | −18.9% | +6.1% | |
| WK Kellogg | Kellanova | Oct 2023 | Packaged food separated from a larger food company | Agreed to be bought by Ferrero in July 2025 | |||
| Magnum | Unilever | Dec 2025 | +16.9% (ten months) |
Magnum’s first ten months sit in the lower half of the group. The median first-year return of the seven with data is +21.8%; the three with a retained parent stake (Haleon, Solventum, BellRing) returned +10.5% to +21.8%, and Magnum’s +16.9% is inside that range. The cases with the largest gains (Sandoz, Lamb Weston, Post) were businesses whose margins or growth rose quickly once they stood alone, which for Magnum is the margin question. The two acquisitions in food, Kellanova by Mars in 2024 and WK Kellogg by Ferrero in 2025, both came within two years of a separation.
In depth: the ice cream market and competitive dynamics
The market: about €75 billion, growing on price
The global market was about €75 billion in 2024 at manufacturers’ prices and grew 3.7% a year from 2014 to 2024; the company expects 3–4% a year to about €90 billion in 2029. Growth comes from price and mix: one industry estimate puts volume growth at 0.3% a year from 2020 to 2025 while value grew 3.4% (MarketLine).
| Segment, 2024 | Size | Growth 2014–24 | Expected growth |
|---|---|---|---|
| Developed markets | €49B | 4.4% a year | 2–3% |
| Emerging markets | €26B | 2.6% | 5–6% |
| At home (supermarkets) | €31.1B (41%) | 3.8% | about 3% |
| Away from home (impulse, cafés) | €40.6B (54%) | 2.9% | 3–4% |
| Digital and quick commerce | €3.4B (4%) | 26.6% | 8–10% |
Source: Magnum’s registration statement, using Euromonitor and GlobalData. Emerging markets are a third of the market and are expected to grow about twice as fast as developed ones.
The category is price-sensitive, as 2023 showed. Under Unilever the business raised prices 9.7% in 2022 and 8.8% in 2023 to cover cocoa, dairy and energy costs; volume fell 0.7% and then 6.0%, with shoppers moving to supermarkets’ own labels and a cool summer. Volume has grown 1.5–2.5% since, and fell 3% in the fourth quarter of 2025.
| Year | Organic growth | Volume | Price |
|---|---|---|---|
| 2022 (Unilever Ice Cream) | +9.0% | −0.7% | +9.7% |
| 2023 (Unilever Ice Cream) | +2.3% | −6.0% | +8.8% |
| 2024 (Unilever Ice Cream) | +3.7% | +1.6% | +2.1% |
| 2025 (Magnum) | +4.2% | +1.5% | +2.6% |
| H1 2026 (Magnum) | +4.7% | +2.5% | +2.2% |
Unilever’s figures are as it reported them for its ice cream business and differ slightly from the carve-out basis in Magnum’s own filings.
Formats are shifting. In the United States (Circana, 52 weeks to December 2025), frozen novelties sold $9.2 billion, up 3%, while tub ice cream sold $7.5 billion, down 1% in value and 3% in units, and cheaper “frozen dairy dessert” grew 29%. Handhelds and pints are growing and large tubs, Breyers’ format, are declining about 2% a year, which the company confirms. Ben & Jerry’s grew 5.5% to $1.1 billion and Yasso, which Unilever bought in 2023, 18% to $420 million.
Weather drives individual quarters. In UK convenience stores ice cream sales rise about 8% for each degree of temperature, against 1.8% for soft drinks (Talysis); in the week to June 27, 2026, with temperatures six degrees above the previous year, UK ice cream sales rose 88% (NIQ). Weather also cuts the other way, as China’s poor May and June 2026 showed in 2026, and Unilever has observed that in extreme heat shoppers switch to cold drinks.
Costs. The main inputs are dairy, cocoa and chocolate coatings, sugar, vegetable oils, packaging and the energy to keep products frozen; neither Magnum nor Froneri discloses the split. Cocoa rose 375% between January 2022 and December 2024, fell back to about $5,100 a tonne by October 2026, and remains volatile. Magnum’s chocolate costs ease in the second half of 2026 as hedges bought at high prices roll off. Its gross margin was 34.6% in 2025, against Froneri’s 41.2%.
The competitors
| Company | Ice cream revenue | Margin | Where it competes | Notes |
|---|---|---|---|---|
| Magnum | €7.9B | Adj. EBITDA 15.9% | Global; first in 9 of its 10 largest markets | 21% global retail share |
| Froneri (Nestlé and PAI) | €5.6B | EBITDAE 21.6% | Europe, US (Dreyer’s/Edy’s, Häagen-Dazs US), Australia | 11% global share; licences for Oreo, Cadbury, Milka, Lotus Biscoff |
| Ferrero (Wells) | over $1.7B | not disclosed | US (Blue Bunny, Halo Top) | Doubling output at its New York plant |
| General Mills | not disclosed | not disclosed | Häagen-Dazs outside the US and Canada | Sold the China shop business in 2026 |
| Yili | about RMB10B | not disclosed | China, first for 31 years | Magnum is second in China |
| Lotte and Binggrae | not disclosed | not disclosed | Korea (about 44% and 41% of a $1.95B market, 2022 shares); Lotte also leads in Japan and owns Havmor in India | |
| Amul | not disclosed | not disclosed | India, about 40% share | Kwality Wall’s has about 10% |
| Supermarket own labels | about $1.6B in the US | US, UK, Germany, France | About 38% of German grocery ice cream sales |
Froneri figures from its 2025 annual report; others from company releases and press estimates; shares from Magnum’s registration statement (Euromonitor, 2024).
Froneri is the competitor that matters. It is smaller but earns a higher margin, reported 21.6% EBITDAE on €5.56 billion of revenue in 2025, partly because its business is weighted to supermarkets and to licensed brands rather than to owned cabinets in emerging markets. It is also much more indebted, at about 6.9 times EBITDA after a €4.7 billion payout to its owners, and it is consolidating: Nestlé said in February 2026 it would sell it its remaining ice cream businesses (in Canada, Chile, Peru, Malaysia, China and Thailand, under CHF1 billion of revenue), and in April 2026 Grupo Herdez agreed to put its Nestlé-licensed Mexican business into a joint venture with Froneri. Its branded volume fell 0.8% in 2025 while its revenue grew 3.1% at constant currency.
Magnum’s position by region: 31% of retail sales in Europe & ANZ, 19% in the Americas (22% in the United States, where Ben & Jerry’s is the second-largest brand) and 11% in AMEA, with more than 80% in Turkey. It is first in nine of its ten largest markets and second in China. In 2026 it reported share gains in the June 2026 heatwave, and share pressure from Häagen-Dazs in the United States and from Froneri in the UK and Germany earlier in the year.
The freezer cabinet, and the regulators
The cabinet is the moat. Magnum owns about three million freezer cabinets, by its estimate about 30% of the world’s ice cream cabinets, adding about 2% a year; about 40% of first-half 2026 capital spending went on cabinets, and India alone is to add 70,000 a year. A cabinet in a corner shop or kiosk carries only the owner’s products unless a regulator says otherwise, which makes the away-from-home channel, Magnum’s highest-margin business in emerging markets, hard to enter.
Regulators have challenged that model repeatedly:
| Year | Where | Case | Outcome |
|---|---|---|---|
| 1992–1998 | EU (Germany) | Langnese-Iglo and Schöller freezer and supply exclusivity | Exclusivity restricted; upheld by the EU courts in 1995 and 1998 |
| 1998–2006 | EU (Ireland) | HB Ice Cream (Unilever) “free” cabinets restricted to HB stock | Infringement found; upheld by the Court of Justice in 2006 |
| 2017 | Italy | Unilever Italia (Algida) exclusivity and loyalty rebates | €60.7 million fine |
| 2018 | Brazil | Unilever (Kibon) | R$29.4 million fine |
| 2021 | Turkey | De facto exclusivity in shops of up to 100 m² | TL480 million fine (about $60 million) |
| 2026 | Turkey | New investigation into Unilever and Magnum; interim order in force from August 15, 2026 | 30% of each cabinet in small shops set aside for rivals or left empty; a separate non-compliance probe opened in May 2026 |
The Turkish case matters most because of its size, about €650 million of revenue at a high margin, and because it is the first remedy that forces space inside the cabinet. The company reported continued share gains in Turkey in discounters and online in the second quarter; the effect in small shops will show from the third quarter.
Retailers, rules and weight-loss drugs
Retailers are concentrated. In the UK the four largest grocers (Tesco, Sainsbury’s, Asda and Aldi) had about 66% of sales in 2024 (Kantar), and spending on promoted items grew far faster than on full-price ones; in Germany Edeka, Schwarz, Rewe and Aldi together have more than 90%; in the United States Walmart has 21%. Freezer space in supermarkets is limited, and own labels are about 38% of German grocery ice cream sales.
UK rules on high-fat, salt and sugar foods ban multibuy promotions from October 2025 and television advertising before 9pm and paid online advertising from January 2026, and cover ice cream. Hungary and Mexico tax sugary or high-calorie foods.
Weight-loss drugs reduce ice cream buying, by an amount still being measured. A Cornell and Numerator study found households with a GLP-1 user cut ice cream spending by 5.5%; Numerator found cuts of 3–9% among users trying to lose weight; Morgan Stanley’s survey found 71% of users ate less ice cream, the largest fall of any category it asked about. The company argues that users favour smaller portions and handhelds, citing an index of 115 for GLP-1 users against 100 for non-users on handheld ice cream. The effect is concentrated in US volume, and it is the main driver of the worst case.
Ben & Jerry’s carries a separate governance risk. Magnum has been in court with the brand’s former independent board and its foundation since 2025. A New York judge dismissed most of the claims in August 2026 and the amounts at stake are small, but co-founder Ben Cohen is campaigning for a sale of the brand, which Magnum says is not for sale.
In depth: valuation against peers
Trailing multiples from Yahoo Finance at the October 9, 2026 close, on each company’s reported basis (Magnum’s trailing EBITDA here, €1.16 billion, is reported rather than adjusted):
| Company | EV / EBITDA | EV / sales | Forward P/E | EBITDA margin | Revenue growth | Dividend yield |
|---|---|---|---|---|---|---|
| Magnum | 10.9× | 1.56× | 14.3× | 14.3% | +4.2% | — |
| Unilever | 11.8× | 2.53× | 16.0× | 21.5% | +0.5% | 3.6% |
| Nestlé | 15.3× | 2.83× | 15.8× | 18.5% | −2.5% | 4.1% |
| Danone | 10.4× | 1.71× | 13.9× | 16.4% | +1.4% | 3.8% |
| General Mills | 8.8× | 1.65× | 10.2× | 18.7% | −2.8% | 7.5% |
| Mondelez | 15.8× | 2.42× | 18.0× | 15.3% | +4.1% | 3.4% |
| Hershey | 13.7× | 3.07× | 16.5× | 22.4% | +6.6% | 3.6% |
| Lindt | 16.8× | 3.31× | 24.2× | 19.8% | −0.2% | 2.3% |
| Kraft Heinz | 7.7× | 1.71× | 10.7× | 22.1% | −1.4% | 7.1% |
| Median of the eight | 12.7× | 2.47× | 15.9× | 19.3% | +0.2% | |
| Froneri (October 2025 transaction) | about 12.5× | 2.7× | 21.6% | +3.1% |
Froneri: an enterprise value of about €15 billion in its October 2025 continuation-fund transaction, against 2025 revenue of €5.56 billion and EBITDAE of €1.20 billion.
Magnum trades below the median on every measure while growing faster than all but two of the eight. The discount is the margin: at 14.3% reported (16% adjusted) it earns less on each euro of sales than every peer except Mondelez, and investors pay for margin in this group. Put Magnum on the peer medians and it is worth:
| Method | Value per share |
|---|---|
| Median EV/EBITDA of 12.7× on trailing reported EBITDA | €18.6 ($20.8) |
| Median forward P/E of 15.9× on consensus forward earnings (about €1.06, or $1.19) | €16.9 ($18.9) |
| Froneri’s 12.5× on 2026 base-case adjusted EBITDA (€1.32 billion) | €21.4 ($24.0) |
| Discounted cash flow, probability-weighted (the target) | €17.1 ($19.1) |
The peer and transaction methods give €16.9–21.4 ($18.9–24.0) and bracket the target. Froneri’s multiple is treated as an upper reference, because Froneri earns a higher margin and its valuation carried the terms of a private transaction. The sales multiple is left out: applied to a lower-margin business it overstates the value.
In depth: is Magnum an acquisition target?
Reuters reported on May 15, 2026 that Blackstone and CD&R were exploring bids, and the shares rose up to 18% that day. Two obstacles stand in the way before December 2027: the US tax restriction, under which Magnum would indemnify Unilever if a takeover caused the demerger to become taxable, and Unilever’s 19.9%, which a buyer would want to buy. After that the logic is plain: a business valued at 9.7 times EBITDA, with Trian on the board and a clear margin plan, is cheap against Froneri’s valuation. A combination with Froneri would face competition review in most of Europe. The acquisition case is a 2028 option and is left out of the target.
Who has been trading
| Dec 8 – Feb 11, 2026 | Feb 11 – Apr 29, 2026 | Apr 29 – Aug 31, 2026 | Aug 31 – Oct 9, 2026 | |
|---|---|---|---|---|
| Magnum (Amsterdam, €) | +26.4% | −31.9% | +58.4% | −12.6% |
| Unilever (London) | +13.7% | −20.8% | +13.3% | −2.1% |
| Packaged food peers | +7.4% | −12.4% | +1.5% | −9.2% |
| Stoxx Europe 600 Food & Beverage | +7.8% | −6.8% | +4.8% | −3.2% |
| Stoxx Europe 600 | +7.5% | −3.0% | +8.0% | −3.9% |
| Magnum on the NYSE ($) | +33.2% | −34.3% | +56.4% | −15.4% |
Closing prices rebased to December 8 = 100. Each line in its local currency; the packaged-food basket is equal-weighted across Nestlé, Danone, General Mills, Mondelez, Hershey, Lindt, Barry Callebaut and Kraft Heinz. Unilever is the London line. Source: Yahoo Finance closes.
Each phase has its own cause. The early gain ended on February 12, 2026, when the first results showed volume up 1.5%, free cash flow of €38 million and no dividend until 2027, and the shares fell 16%. The slide to the April 29, 2026 low followed Goldman Sachs’ Sell rating (March 19, 2026), BNP Paribas Exane’s downgrade on weight-loss drugs (April 21, 2026), and a build-up of short positions to a disclosed 3–4% of the shares in Amsterdam. The 58% rise to August 2026 came from a first-quarter beat (shares +11% on April 30, 2026), the Reuters report of private-equity interest (May 15, 2026), a half-year EBITDA ahead of consensus and a hot northern European summer, with short sellers closing their positions and the company buying shares for its incentive plans from August 18, 2026. The 12.6% fall since August 31, 2026 has no company news behind it: guidance was reaffirmed on September 8, 2026 and analysts mostly raised targets. It came with a sell-off in packaged food after Campbell’s cut its dividend on September 3, 2026 and Lindt cut its sales outlook on September 29, 2026, with the third quarter facing the toughest comparison of the year after a hot summer, and, for the NYSE line, with the euro falling 3.3% against the dollar. Day to day since May 2026, Magnum’s returns correlate most with European food and beverage stocks (0.53).
Daily volume summed across Euronext Amsterdam, the London Stock Exchange and the NYSE (bars), and cumulative volume as a share of the 612.3 million shares outstanding (line). Trading on other European venues is not included, so turnover is understated. Gold bars mark days with a notable event; hover over one to see what happened. Source: Yahoo Finance, through Oct 9, 2026.
| Average daily volume, three exchanges | Share of the company traded | |
|---|---|---|
| December 2025 | 18.7M | 51.9% |
| January 2026 | 5.4M | 18.4% |
| February 2026 | 6.6M | 21.6% |
| March 2026 | 5.0M | 17.8% |
| April 2026 | 5.1M | 17.4% |
| May 2026 | 4.1M | 14.1% |
| June 2026 | 3.3M | 12.0% |
| July 2026 | 2.6M | 9.6% |
| August 2026 | 2.3M | 7.9% |
| September 2026 | 2.1M | 7.6% |
| Since the spin | 180.9%, about 226% of the free float |
The forced selling came on December 10, 2025 and was a UK index trade. FTSE added Magnum to the FTSE 100 alongside Unilever on December 8, 2025 and removed it from the UK series from December 11, 2025 because it is a Dutch company, so UK index funds sold at the December 10, 2025 close, an estimated $580 million, about 30–40 million shares; 47.8 million shares traded in London that day. Every other index family kept Magnum from the first day and has not changed it: the AEX in Amsterdam, MSCI’s standard indexes as a mid cap, the STOXX Europe 600 and FTSE’s European indexes. Eurozone index funds, which had not held Unilever since 2020, bought. 28.8% of the company traded in the first three sessions, against 11% for a spinoff placed straight into the S&P 500 and 38–56% for those placed into the S&P SmallCap 600. These volumes cover only the three main exchanges; trading on other European venues adds to them.
Insiders have bought, and the company is buying. Directors and executives bought about €21.7 million of shares in the open market, with almost no sales. The company bought 5.40 million shares at an average €17.00 between August 18 and September 9, 2026 and 3.05 million at €16.70 by September 30, 2026 for its incentive plans.
Short sellers have mostly left Amsterdam. Disclosed short positions of 0.5% or more, published by the AFM, peaked at about 3–4% of the shares from late March 2026 to mid-May 2026 (Marshall Wace 1.60%, Qube 1.11%, Walleye, Ilex, GLG, JPMorgan Asset Management) and are now two positions totalling about 1.1% (Ilex and Capital Fund Management). Short interest in the NYSE line is 9.3 million shares (1.5% of the company, about thirteen days of NYSE volume) and has fallen from 13.6 million in June 2026; part of it is likely to hedge positions in the Amsterdam line.
Holders. Unilever’s 19.85% is unchanged. The other holders above 3% notified to the AFM are T. Rowe Price (5.50%), BlackRock (3.85%), Trian (3.69%), First Eagle (3.14%), the Allan & Gill Gray Foundation through Orbis (3.21%) and Madison Avenue (3.02%); Fidelity’s FMR fell below 3% on October 6, 2026, and Orbis’ Schedule 13G fell from 5.1% to 4.7% between March and June 2026. Among Unilever’s US holders, who received one Magnum share for every five Unilever shares, most dropped the spinoff: GQG, Jennison, Fiduciary Management and American Century show no Magnum position, and Fisher held 0.66 million shares against an entitlement of about 4.5 million. The buyers were value managers: T. Rowe Price, First Eagle, Pzena, Flossbach von Storch, Aristotle, Sessa, Madison Avenue and Trian.
The supply still to come is Unilever’s. Its 121.6 million shares are about 57 trading days of volume on the three main exchanges at the September 2026 rate. A sale would most likely come as a placement at a discount, as GSK’s and Pfizer’s sales of Haleon did, and the price could weaken around it; the company’s own buying and the value holders already on the register are the natural buyers.
Interest rates
€3.0 billion of the borrowing is fixed-rate bonds at 2.75–4% maturing from 2029 to 2037, with an average maturity of 7.5 years; the term loans (€100 million drawn in Europe and a facility for India) and short-term borrowing float. A one-point move in euro rates changes annual interest by an estimated €4–7 million, under 1% of earnings. The discount rate matters far more, at about €2 ($2.2) a share for each half point, as the table above shows.
Tail scenarios
Upside tails
- A bid after December 2027. Private-equity interest is reported and Froneri is valued well above Magnum on sales. A bid at Froneri’s sales multiple on 2027 revenue would be worth an estimated €32 ($36) a share; the timing and the Unilever stake make it an option rather than a forecast.
- Margins reach 20% by 2029. The chief executive’s aim, if the productivity program delivers its full €500 million and cocoa eases, would put the value near the best case or above it.
- Unilever’s stake placed cleanly into the value holders now on the register, removing the overhang without a discount.
Downside tails
- Volume decline from weight-loss drugs across developed markets, pushing toward the worst case.
- Turkey’s cabinet order made permanent and copied elsewhere, weakening the away-from-home model that earns the highest margins.
- A cocoa spike in 2027: futures doubled between April and August 2026, and hedges run only six to nine months.
- A discounted block sale by Unilever in a weak market.
What would change this view
| Better | Volume growth above 2.5% with the margin rising at least 40 basis points a year; free cash flow on track for the €0.8–1.0 billion target; Unilever’s stake placed without a large discount |
| Worse | Volume falling in the Americas or Europe; the 2026 reported margin below 15.9%; the Turkish order made permanent; cocoa costs rising again in 2027 |
| Dated | Third-quarter trading update (about October 30, 2026); full-year results and the first dividend (February 2027); the end of the transitional agreements (end-2027); the US tax restriction lapsing (about December 2027) |
| Thesis-breaking | Two consecutive half-years of negative volume, or a margin below 15% |
Investment Scorecard
| Dimension | Weight | Score | Rationale |
|---|---|---|---|
| Financial Profile | 25% | 3.5 | A 16% EBITDA margin, inside the 15–30% band, and organic growth of about 4%; leverage of 2.5 times and a margin that fell a point in 2025 hold it below 4 |
| Competitive Position | 25% | 4.0 | Global leader with twice the share of the next competitor, four of the five largest brands and three million freezer cabinets. Held below 4.5 by the Turkish order and the decline of US large tubs |
| Strategic Rationale | 20% | 3.5 | A clear separation of a business with its own seasonality and supply chain, and Unilever benefits too. The €3 billion of debt, transitional agreements to 2027 and the unsold 19.9% hold it at 3.5 |
| Management & Governance | 20% | 4.0 | The chief executive ran the business before the separation, the team is complete, pay is weighted to shares, and executives bought €21.7 million of stock. A 22.6% vote against the option plan and the Ben & Jerry’s dispute keep it from 4.5 |
| Acquisition Potential | 10% | 3.0 | Reported private-equity interest and Trian on the board, but the US tax restriction and Unilever’s stake block a deal before December 2027 |
| Weighted Score | 3.68 | ||
| Investment Grade | A- | Strong Opportunity |
What moved and what deliberately did not. This is Magnum’s first grade on this site. Competitive Position and Management carry it: the market position and the insiders’ own money are the strongest evidence in the file. The margin shortfall of 2025 is charged once, to Financial Profile, and not again to Strategic Rationale, where only the separation’s structure is scored. Unilever’s stake is charged to Strategic Rationale as an overhang and not to Acquisition Potential, where only the tax restriction is scored. The grade measures the business; the rating below measures the price, and they point in different directions here because the stock has already risen 19% from its first day.
October 2026 recommendation
Rating: HOLD. Target: €17.1 ($19.15). Grade: A- (3.68).
Why HOLD rather than ACCUMULATE.
- The weighted value is 11% above the price, and the base case 16%: real upside, but less than the 20% or more that would justify building a position at any price.
- Unilever’s 19.9% is unsold, with no lock-up, and a placement is likely within the next year or two.
- The third-quarter update on about October 30, 2026 faces the toughest comparison of the year after a hot 2025 summer, and the company has said it cannot yet say how it is trading.
Why HOLD rather than SELL.
- The price sits at the level where expected gain is twice expected loss (€15.38, or $17.23), and implies a 42% chance of the worst case, which the first-half volumes argue against.
- Insiders have put €21.7 million of their own money in, and the company is buying shares for its incentive plans.
- The business is the market leader with a margin plan management is paid to deliver, and a bid becomes possible from 2028.
Action for October 2026:
| Accumulate below €15.40 ($17.25) | Where expected gain is twice expected loss; the stock closed at €15.36 ($17.21) on October 9, 2026 |
| Hold between €15.40 ($17.25) and €18.00 ($20.20) | |
| Trim above €18.00 ($20.20) | The base-case value |
| Move to ACCUMULATE at any price below the target | A clean placement of Unilever’s stake, or a third quarter showing volume growth with the margin on track for +40–60 basis points |
| Move to SELL | Volume falling for a second half-year, or the 2026 reported margin below 15.9% |
What to watch in the third-quarter update (about October 30, 2026):
| Line | The test |
|---|---|
| Organic growth | Inside the 3–5% range for the year, against the toughest comparison of 2026 |
| Volume | Positive, especially in the Americas and Europe |
| Turkey | The effect of the cabinet order, and whether it becomes permanent |
| Margin | The second-half improvement needed for the reported +0–20 basis points |
| Cocoa | Any comment on 2027 costs after the summer’s price rise |
| Unilever’s stake | Any sale, and its price |
| Free cash flow | On track for the full year after €273 million in the first half |