Millrose Properties MRP
+9.1%vs Day 1Spinoff of Lennar (LEN) · Classic Spinoff · REIT · Spun Feb 7, 2025
Expected return (11/13/2026): -2% Gain to loss: 0.7 : 1Land lender to homebuilders (68% Lennar): $8.8B at a 9.2% yield, no option terminated. At 0.63x book and a 14.1% yield it trades like lending REITs with far more debt. Growth has stopped (100% payout, no equity below book, at its debt limit), and the unannounced purchases of finished Lennar homes to rent are about $483M gross (4.6% of assets) with no disclosed approval, pricing or cap. Weighted value $25.40; HOLD, target $25.
Current Stats
Post-Spinoff Performance
| Timeline | |
| Spinoff date | February 7, 2025 · NYSE REIT |
| Days since spinoff | 645 days |
| Structure | Classic Spinoff |
| §355(e) window closes statutory; a tax matters agreement may bar more, and for longer | February 7, 2027 |
| Parent | Lennar (LEN) |
| Day-1 reaction | |
| Day 1 open | $23.49 |
| Day 1 return (open→close) | +13.8% |
| Day 1 price (close) | $26.74 reported $23.49 (open) |
| Day 1 range | $22.26 – $27.07 +21.6% spread |
| Day 1 low held? | Breached after 2 sessions to -5.6% below |
| Price levels | |
| Post-spin low (closing) | $21.22 on Mar 11, 2025 · 32 days post-spin |
| Lowest traded | $21.02 on Mar 13, 2025 · 34 days post-spin |
| Current price (Nov 13, 2026) | $25.87 |
| Returns | |
| Return vs Day 1 (close) | +15.0% |
| — range by day 1 entry theoretical bounds | +13.6% to +38.1% |
| Return vs post-spin low (price) | +21.9% |
| Total return vs low incl. dividends since | +44.9% |
| First-quarter return (≈90d) | -1.3% |
| 1-year return | +28.0% |
| Annualized return (CAGR) | +8.2% |
| Versus benchmarks | |
| S&P 500 over same window | +28.2% |
| Annualized excess vs S&P | -6.9% |
| Shares & ownership | |
| Shares outstanding Sep 30, 2026 | 166,047,927 |
| Diluted average shares the EPS denominator | 166,064,538 |
| Free float | 153,104,491 99% of shares outstanding |
| Held by institutions | 96% insiders 1.3% |
| Share count trend Mar 2025 → Sep 2026 | +0.0% broadly flat |
| Volume & liquidity | |
| Traded per day 20-session median | $55M |
| Normal volume baseline | 1,040,000 shares · now 2.09x |
| Day 1 volume | 40.1x normal · first week 16.3x |
| Decay | half in 2 sessions · normal by 19 |
Computed from split-adjusted closing prices. Returns are total return — (end price + dividends received − start price) ÷ start price — with no reinvestment assumed.
Price History
Closing price, split-adjusted, with volume below. The Price line excludes dividends; Price + dividends adds the cash paid out, with no reinvestment assumed. Individual payments are listed in the table below. Source: Yahoo Finance. Data through Nov 14, 2026.
Raw daily price & volume data · dividends marked
| Date | Open | High | Low | Close | Volume | Float | Turnover | Market cap | Dividend | Split |
|---|---|---|---|---|---|---|---|---|---|---|
| 2026-11-13 | $25.78 | $25.97 | $25.41 | $25.87 | 1,708,200 | 153,104,491 | 1.03% | $4.30B | — | — |
| 2026-11-12 | $26.00 | $26.13 | $25.63 | $25.67 | 1,265,700 | 153,104,491 | 0.76% | $4.26B | — | — |
| 2026-11-11 | $25.99 | $26.16 | $25.71 | $26.03 | 1,286,300 | 153,104,491 | 0.77% | $4.32B | — | — |
| 2026-11-10 | $26.23 | $26.54 | $25.88 | $26.12 | 1,574,100 | 153,104,491 | 0.95% | $4.34B | — | — |
| 2026-11-09 | $26.41 | $26.83 | $26.17 | $26.61 | 1,567,400 | 153,104,491 | 0.94% | $4.42B | — | — |
| 2026-11-06 | $26.15 | $26.31 | $25.89 | $25.92 | 1,403,500 | 153,104,491 | 0.85% | $4.30B | — | — |
| 2026-11-05 | $26.93 | $27.22 | $26.25 | $26.50 | 2,097,000 | 153,104,491 | 1.26% | $4.40B | — | — |
| 2026-11-04 | $26.29 | $27.00 | $26.09 | $26.93 | 2,883,100 | 153,104,491 | 1.74% | $4.47B | — | — |
| 2026-11-03 | $26.61 | $26.72 | $25.82 | $25.90 | 2,843,000 | 153,104,491 | 1.71% | $4.30B | — | — |
| 2026-11-02 | $26.00 | $26.83 | $25.75 | $26.81 | 2,598,000 | 153,104,491 | 1.56% | $4.45B | — | — |
| 2026-10-30 | $26.25 | $26.50 | $25.48 | $25.62 | 2,131,600 | 153,104,491 | 1.28% | $4.25B | — | — |
| 2026-10-29 | $25.70 | $26.13 | $25.40 | $26.11 | 2,402,000 | 153,104,491 | 1.45% | $4.34B | — | — |
| 2026-10-28 | $24.65 | $25.38 | $24.53 | $25.38 | 2,918,400 | 153,104,491 | 1.76% | $4.21B | — | — |
| 2026-10-27 | $24.59 | $25.63 | $23.45 | $24.31 | 4,977,800 | 153,104,491 | 3.00% | $4.04B | — | — |
| 2026-10-26 | $23.95 | $24.29 | $23.75 | $23.91 | 2,213,400 | 153,104,491 | 1.33% | $3.97B | — | — |
| 2026-10-23 | $23.86 | $23.99 | $23.67 | $23.86 | 1,803,900 | 153,104,491 | 1.09% | $3.96B | — | — |
| 2026-10-22 | $22.99 | $23.98 | $22.94 | $23.97 | 2,584,800 | 153,104,491 | 1.56% | $3.98B | — | — |
| 2026-10-21 | $23.67 | $24.06 | $22.80 | $23.09 | 2,707,500 | 153,104,491 | 1.63% | $3.83B | — | — |
| 2026-10-20 | $22.08 | $23.50 | $22.03 | $23.46 | 3,397,200 | 153,104,491 | 2.05% | $3.90B | — | — |
| 2026-10-19 | $22.49 | $22.49 | $21.85 | $21.98 | 2,073,800 | 153,104,491 | 1.25% | $3.65B | — | — |
| 2026-10-16 | $22.35 | $22.78 | $22.07 | $22.50 | 3,145,600 | 153,104,491 | 1.89% | $3.74B | — | — |
| 2026-10-15 | $21.62 | $22.26 | $21.39 | $22.22 | 4,745,500 | 153,104,491 | 2.86% | $3.69B | — | — |
| 2026-10-14 | $22.05 | $22.20 | $21.07 | $21.22 | 4,938,000 | 153,104,491 | 2.97% | $3.52B | — | — |
| 2026-10-13 | $22.47 | $22.59 | $21.97 | $22.39 | 2,641,200 | 153,104,491 | 1.59% | $3.72B | — | — |
| 2026-10-12 | $22.25 | $22.65 | $21.96 | $22.28 | 2,824,000 | 153,104,491 | 1.70% | $3.70B | — | — |
| 2026-10-09 | $22.64 | $22.78 | $21.91 | $22.36 | 4,496,500 | 153,104,491 | 2.71% | $3.71B | — | — |
| 2026-10-08 | $22.57 | $22.83 | $21.66 | $22.63 | 5,788,100 | 153,104,491 | 3.49% | $3.76B | — | — |
| 2026-10-07 | $23.03 | $23.12 | $22.39 | $22.62 | 2,889,000 | 153,104,491 | 1.74% | $3.76B | — | — |
| 2026-10-06 | $22.80 | $23.34 | $22.65 | $23.17 | 5,362,100 | 153,104,491 | 3.23% | $3.85B | — | — |
| 2026-10-05 | $23.24 | $23.25 | $21.85 | $22.51 | 7,285,200 | 153,104,491 | 4.39% | $3.74B | $0.79 | — |
| 2026-10-02 | $25.50 | $26.05 | $23.44 | $24.61 | 8,865,500 | 153,104,491 | 5.34% | $4.09B | — | — |
| 2026-10-01 | $25.95 | $25.97 | $24.92 | $25.20 | 3,640,200 | 153,104,491 | 2.19% | $4.18B | — | — |
| 2026-09-30 | $26.80 | $27.06 | $25.92 | $25.97 | 3,550,700 | 153,104,491 | 2.14% | $4.31B | — | — |
| 2026-09-29 | $26.40 | $26.81 | $26.23 | $26.51 | 2,206,300 | 153,104,491 | 1.33% | $4.40B | — | — |
| 2026-09-28 | $27.16 | $27.21 | $26.28 | $26.34 | 2,874,800 | 153,104,491 | 1.73% | $4.37B | — | — |
| 2026-09-25 | $27.00 | $27.26 | $26.83 | $27.19 | 1,862,100 | 153,104,491 | 1.12% | $4.51B | — | — |
| 2026-09-24 | $27.05 | $27.78 | $26.93 | $27.06 | 2,725,500 | 153,104,491 | 1.64% | $4.49B | — | — |
| 2026-09-23 | $28.59 | $28.59 | $26.72 | $26.81 | 2,956,300 | 153,104,491 | 1.78% | $4.45B | — | — |
| 2026-09-22 | $28.75 | $29.00 | $28.30 | $28.73 | 1,664,900 | 153,104,491 | 1.00% | $4.77B | — | — |
| 2026-09-21 | $28.91 | $29.08 | $28.57 | $28.68 | 1,281,400 | 153,104,491 | 0.77% | $4.76B | — | — |
| 2026-09-18 | $28.70 | $29.00 | $28.43 | $28.87 | 5,618,300 | 153,104,491 | 3.38% | $4.79B | — | — |
| 2026-09-17 | $29.30 | $29.48 | $28.54 | $28.79 | 1,178,700 | 153,104,491 | 0.71% | $4.78B | — | — |
| 2026-09-16 | $29.53 | $29.65 | $28.68 | $28.95 | 1,694,500 | 153,104,491 | 1.02% | $4.81B | — | — |
| 2026-09-15 | $29.40 | $29.45 | $29.10 | $29.44 | 1,357,700 | 153,104,491 | 0.82% | $4.89B | — | — |
| 2026-09-14 | $29.54 | $29.86 | $29.34 | $29.46 | 1,097,200 | 153,104,491 | 0.66% | $4.89B | — | — |
| 2026-09-11 | $29.92 | $29.97 | $29.60 | $29.69 | 833,500 | 153,104,491 | 0.50% | $4.93B | — | — |
| 2026-09-10 | $30.37 | $30.43 | $29.35 | $29.59 | 1,330,600 | 153,104,491 | 0.80% | $4.91B | — | — |
| 2026-09-09 | $30.78 | $30.92 | $30.22 | $30.49 | 1,077,900 | 153,104,491 | 0.65% | $5.06B | — | — |
| 2026-09-08 | $32.01 | $32.17 | $30.71 | $30.78 | 1,460,800 | 153,104,491 | 0.88% | $5.11B | — | — |
| 2026-09-04 | $31.58 | $32.11 | $31.52 | $32.02 | 1,227,800 | 153,104,491 | 0.74% | $5.32B | — | — |
| 2026-09-03 | $31.23 | $31.77 | $31.03 | $31.72 | 1,241,600 | 153,104,491 | 0.75% | $5.27B | — | — |
| 2026-09-02 | $30.73 | $31.06 | $30.57 | $30.86 | 1,220,200 | 153,104,491 | 0.73% | $5.12B | — | — |
| 2026-09-01 | $30.34 | $31.03 | $30.28 | $30.58 | 1,137,000 | 153,104,491 | 0.68% | $5.08B | — | — |
| 2026-08-31 | $30.44 | $30.63 | $30.18 | $30.42 | 1,077,000 | 153,104,491 | 0.65% | $5.05B | — | — |
| 2026-08-28 | $30.63 | $30.87 | $30.38 | $30.61 | 708,900 | 153,104,491 | 0.43% | $5.08B | — | — |
| 2026-08-27 | $30.70 | $30.83 | $30.47 | $30.50 | 708,400 | 153,104,491 | 0.43% | $5.06B | — | — |
| 2026-08-26 | $30.90 | $30.90 | $30.63 | $30.67 | 771,100 | 153,104,491 | 0.46% | $5.09B | — | — |
| 2026-08-25 | $30.69 | $30.96 | $30.36 | $30.96 | 581,300 | 153,104,491 | 0.35% | $5.14B | — | — |
| 2026-08-24 | $30.55 | $30.80 | $30.31 | $30.51 | 804,400 | 153,104,491 | 0.48% | $5.07B | — | — |
| 2026-08-21 | $30.64 | $30.74 | $30.33 | $30.39 | 1,020,000 | 153,104,491 | 0.61% | $5.05B | — | — |
| 2026-08-20 | $30.42 | $30.66 | $30.18 | $30.58 | 886,000 | 153,104,491 | 0.53% | $5.08B | — | — |
| 2026-08-19 | $30.23 | $30.70 | $30.17 | $30.52 | 884,600 | 153,104,491 | 0.53% | $5.07B | — | — |
| 2026-08-18 | $30.29 | $30.31 | $29.93 | $29.94 | 983,300 | 153,104,491 | 0.59% | $4.97B | — | — |
| 2026-08-17 | $30.31 | $30.35 | $30.01 | $30.16 | 1,232,000 | 153,104,491 | 0.74% | $5.01B | — | — |
| 2026-08-14 | $30.17 | $30.49 | $30.08 | $30.33 | 902,800 | 153,104,491 | 0.54% | $5.04B | — | — |
| 2026-08-13 | $29.93 | $30.31 | $29.92 | $30.24 | 848,900 | — | 0.51% | $5.02B | — | — |
| 2026-08-12 | $29.67 | $29.88 | $29.60 | $29.76 | 842,100 | — | 0.51% | $4.94B | — | — |
| 2026-08-11 | $29.05 | $29.84 | $28.83 | $29.73 | 1,127,800 | — | 0.68% | $4.94B | — | — |
| 2026-08-10 | $28.86 | $29.00 | $28.66 | $28.80 | 913,700 | — | 0.55% | $4.78B | — | — |
| 2026-08-07 | $29.00 | $29.38 | $28.92 | $28.98 | 959,900 | — | 0.58% | $4.81B | — | — |
| 2026-08-06 | $29.54 | $29.59 | $28.63 | $28.81 | 1,059,300 | — | 0.64% | $4.78B | — | — |
| 2026-08-05 | $29.58 | $30.14 | $29.27 | $29.34 | 1,123,500 | — | 0.68% | $4.87B | — | — |
| 2026-08-04 | $28.99 | $29.52 | $28.10 | $29.42 | 1,776,600 | — | 1.07% | $4.89B | — | — |
| 2026-08-03 | $28.31 | $28.83 | $28.31 | $28.65 | 1,514,400 | — | 0.91% | $4.76B | — | — |
| 2026-07-31 | $28.22 | $28.39 | $27.73 | $27.98 | 1,072,200 | — | 0.65% | $4.65B | — | — |
| 2026-07-30 | $28.26 | $28.37 | $27.71 | $28.22 | 1,177,000 | — | 0.71% | $4.69B | — | — |
| 2026-07-29 | $28.57 | $28.57 | $27.99 | $28.04 | 1,256,200 | — | 0.76% | $4.66B | — | — |
| 2026-07-28 | $28.47 | $28.72 | $28.38 | $28.59 | 1,096,700 | — | 0.66% | $4.75B | — | — |
| 2026-07-27 | $28.56 | $28.70 | $28.39 | $28.40 | 976,400 | — | 0.59% | $4.72B | — | — |
| 2026-07-24 | $28.48 | $28.80 | $28.38 | $28.52 | 831,100 | — | 0.50% | $4.74B | — | — |
| 2026-07-23 | $28.34 | $28.59 | $28.12 | $28.28 | 1,022,800 | — | 0.62% | $4.70B | — | — |
| 2026-07-22 | $28.45 | $28.73 | $28.32 | $28.61 | 974,700 | — | 0.59% | $4.75B | — | — |
| 2026-07-21 | $28.93 | $29.01 | $28.24 | $28.36 | 1,239,500 | — | 0.75% | $4.71B | — | — |
| 2026-07-20 | $29.50 | $29.52 | $28.69 | $28.81 | 1,099,600 | — | 0.66% | $4.78B | — | — |
| 2026-07-17 | $29.60 | $29.89 | $29.16 | $29.42 | 1,263,700 | — | 0.76% | $4.89B | — | — |
| 2026-07-16 | $28.75 | $29.64 | $28.75 | $29.57 | 1,484,600 | — | 0.89% | $4.91B | — | — |
| 2026-07-15 | $28.39 | $28.92 | $28.39 | $28.75 | 1,503,800 | — | 0.91% | $4.77B | — | — |
| 2026-07-14 | $28.32 | $28.45 | $27.92 | $28.33 | 1,219,500 | — | 0.73% | $4.70B | — | — |
| 2026-07-13 | $28.47 | $28.66 | $28.07 | $28.17 | 944,800 | — | 0.57% | $4.68B | — | — |
| 2026-07-10 | $28.53 | $28.64 | $28.30 | $28.37 | 1,076,700 | — | 0.65% | $4.71B | — | — |
| 2026-07-09 | $28.36 | $28.53 | $28.08 | $28.32 | 1,238,800 | — | 0.75% | $4.70B | — | — |
| 2026-07-08 | $28.25 | $28.34 | $27.94 | $28.18 | 1,180,400 | — | 0.71% | $4.68B | — | — |
| 2026-07-07 | $28.40 | $28.69 | $28.30 | $28.32 | 1,260,200 | — | 0.76% | $4.70B | — | — |
| 2026-07-06 | $28.99 | $29.23 | $28.37 | $28.37 | 1,517,500 | — | 0.91% | $4.71B | $0.77 | — |
| 2026-07-02 | $29.87 | $30.15 | $29.61 | $29.77 | 1,385,200 | — | 0.83% | $4.94B | — | — |
| 2026-07-01 | $30.04 | $30.44 | $29.65 | $29.66 | 1,589,500 | — | 0.96% | $4.92B | — | — |
| 2026-06-30 | $30.42 | $30.61 | $29.87 | $30.05 | 1,860,500 | — | 1.12% | $4.99B | — | — |
| 2026-06-29 | $30.85 | $31.21 | $30.58 | $30.68 | 2,100,800 | — | 1.27% | $5.09B | — | — |
| 2026-06-26 | $29.85 | $30.93 | $29.70 | $30.93 | 3,665,300 | — | 2.21% | $5.13B | — | — |
| 2026-06-25 | $29.60 | $30.15 | $29.52 | $29.89 | 1,325,300 | — | 0.80% | $4.96B | — | — |
| 2026-06-24 | $29.37 | $29.92 | $29.20 | $29.40 | 1,387,100 | — | 0.84% | $4.88B | — | — |
| 2026-06-23 | $28.17 | $29.25 | $28.17 | $28.99 | 1,138,000 | — | 0.69% | $4.81B | — | — |
| 2026-06-22 | $28.38 | $28.56 | $28.16 | $28.49 | 1,975,000 | — | 1.19% | $4.73B | — | — |
| 2026-06-18 | $28.49 | $28.86 | $28.38 | $28.40 | 8,733,100 | — | 5.26% | $4.71B | — | — |
| 2026-06-17 | $28.56 | $29.01 | $27.94 | $28.06 | 1,814,600 | — | 1.09% | $4.66B | — | — |
| 2026-06-16 | $29.06 | $29.15 | $28.51 | $28.70 | 1,512,800 | — | 0.91% | $4.76B | — | — |
| 2026-06-15 | $29.56 | $29.72 | $28.98 | $29.07 | 1,553,200 | — | 0.94% | $4.83B | — | — |
| 2026-06-12 | $29.27 | $29.64 | $29.11 | $29.13 | 1,318,900 | — | 0.79% | $4.84B | — | — |
| 2026-06-11 | $28.98 | $29.39 | $28.75 | $29.28 | 1,478,700 | — | 0.89% | $4.86B | — | — |
| 2026-06-10 | $29.20 | $29.52 | $28.78 | $28.80 | 1,551,700 | — | 0.93% | $4.78B | — | — |
| 2026-06-09 | $29.12 | $29.61 | $29.06 | $29.30 | 1,641,500 | — | 0.99% | $4.86B | — | — |
| 2026-06-08 | $28.93 | $29.26 | $28.78 | $28.90 | 1,455,000 | — | 0.88% | $4.80B | — | — |
| 2026-06-05 | $28.57 | $29.21 | $28.56 | $28.93 | 1,377,700 | — | 0.83% | $4.80B | — | — |
| 2026-06-04 | $27.88 | $29.27 | $27.84 | $28.81 | 2,182,200 | — | 1.31% | $4.78B | — | — |
| 2026-06-03 | $27.67 | $27.95 | $27.36 | $27.54 | 990,000 | — | 0.60% | $4.57B | — | — |
| 2026-06-02 | $27.62 | $28.03 | $27.55 | $27.83 | 1,354,900 | — | 0.82% | $4.62B | — | — |
| 2026-06-01 | $28.00 | $28.17 | $27.43 | $27.73 | 2,144,500 | — | 1.29% | $4.60B | — | — |
| 2026-05-29 | $27.92 | $28.45 | $27.88 | $28.22 | 1,340,500 | — | 0.81% | $4.68B | — | — |
| 2026-05-28 | $28.00 | $28.38 | $27.75 | $28.14 | 1,313,400 | — | 0.79% | $4.67B | — | — |
| 2026-05-27 | $27.84 | $28.35 | $27.84 | $28.06 | 870,100 | — | 0.52% | $4.66B | — | — |
| 2026-05-26 | $27.86 | $27.94 | $27.56 | $27.67 | 1,205,300 | — | 0.73% | $4.59B | — | — |
| 2026-05-22 | $27.61 | $27.77 | $27.10 | $27.63 | 1,597,500 | — | 0.96% | $4.59B | — | — |
| 2026-05-21 | $27.55 | $27.74 | $26.97 | $27.55 | 1,259,800 | — | 0.76% | $4.57B | — | — |
| 2026-05-20 | $26.84 | $27.76 | $26.70 | $27.66 | 1,887,500 | — | 1.14% | $4.59B | — | — |
| 2026-05-19 | $27.01 | $27.07 | $26.58 | $26.65 | 1,613,100 | — | 0.97% | $4.42B | — | — |
| 2026-05-18 | $26.89 | $27.29 | $26.66 | $26.93 | 1,386,200 | — | 0.84% | $4.47B | — | — |
| 2026-05-15 | $27.16 | $27.20 | $26.38 | $26.71 | 2,035,700 | — | 1.23% | $4.43B | — | — |
| 2026-05-14 | $27.07 | $27.40 | $26.91 | $27.30 | 1,637,500 | — | 0.99% | $4.53B | — | — |
| 2026-05-13 | $26.70 | $27.33 | $26.30 | $26.67 | 2,273,100 | — | 1.37% | $4.43B | — | — |
| 2026-05-12 | $27.28 | $27.28 | $26.52 | $26.60 | 2,328,200 | — | 1.40% | $4.42B | — | — |
| 2026-05-11 | $27.10 | $27.53 | $27.06 | $27.29 | 2,227,900 | — | 1.34% | $4.53B | — | — |
| 2026-05-08 | $27.14 | $27.65 | $26.78 | $26.93 | 2,422,100 | — | 1.46% | $4.47B | — | — |
| 2026-05-07 | $28.21 | $28.21 | $26.85 | $26.90 | 2,789,000 | — | 1.68% | $4.47B | — | — |
| 2026-05-06 | $30.51 | $31.09 | $26.82 | $28.19 | 4,346,400 | — | 2.62% | $4.68B | — | — |
| 2026-05-05 | $29.73 | $30.31 | $29.58 | $30.09 | 1,016,600 | — | 0.61% | $5.00B | — | — |
| 2026-05-04 | $30.20 | $30.36 | $29.47 | $29.55 | 1,033,100 | — | 0.62% | $4.91B | — | — |
| 2026-05-01 | $30.84 | $30.97 | $30.14 | $30.37 | 1,149,200 | — | 0.69% | $5.04B | — | — |
| 2026-04-30 | $30.65 | $30.85 | $30.49 | $30.67 | 1,434,100 | — | 0.86% | $5.09B | — | — |
| 2026-04-29 | $30.65 | $30.91 | $30.33 | $30.49 | 928,700 | — | 0.56% | $5.06B | — | — |
| 2026-04-28 | $30.76 | $31.00 | $30.30 | $30.72 | 793,000 | — | 0.48% | $5.10B | — | — |
| 2026-04-27 | $30.75 | $31.22 | $30.49 | $30.70 | 860,700 | — | 0.52% | $5.10B | — | — |
| 2026-04-24 | $30.56 | $30.86 | $30.32 | $30.73 | 689,400 | — | 0.42% | $5.10B | — | — |
| 2026-04-23 | $30.66 | $30.92 | $30.25 | $30.49 | 792,600 | — | 0.48% | $5.06B | — | — |
| 2026-04-22 | $31.00 | $31.02 | $30.37 | $30.61 | 887,800 | — | 0.53% | $5.08B | — | — |
| 2026-04-21 | $31.13 | $31.19 | $30.61 | $30.76 | 764,800 | — | 0.46% | $5.11B | — | — |
| 2026-04-20 | $30.88 | $31.10 | $30.65 | $31.00 | 912,700 | — | 0.55% | $5.15B | — | — |
| 2026-04-17 | $30.84 | $31.49 | $30.81 | $31.03 | 1,455,100 | — | 0.88% | $5.15B | — | — |
| 2026-04-16 | $30.53 | $30.88 | $30.37 | $30.63 | 1,068,000 | — | 0.64% | $5.08B | — | — |
| 2026-04-15 | $30.70 | $30.83 | $30.31 | $30.43 | 1,012,500 | — | 0.61% | $5.05B | — | — |
| 2026-04-14 | $30.50 | $31.44 | $30.50 | $30.81 | 2,382,900 | — | 1.44% | $5.11B | — | — |
| 2026-04-13 | $30.43 | $30.73 | $30.06 | $30.72 | 1,103,100 | — | 0.66% | $5.10B | — | — |
| 2026-04-10 | $30.14 | $30.58 | $30.10 | $30.57 | 1,033,800 | — | 0.62% | $5.07B | — | — |
| 2026-04-09 | $28.79 | $30.12 | $28.74 | $29.92 | 1,259,300 | — | 0.76% | $4.97B | — | — |
| 2026-04-08 | $28.50 | $28.92 | $28.43 | $28.84 | 1,374,400 | — | 0.83% | $4.79B | — | — |
| 2026-04-07 | $27.82 | $27.93 | $27.62 | $27.72 | 984,400 | — | 0.59% | $4.60B | — | — |
| 2026-04-06 | $27.50 | $27.98 | $27.42 | $27.90 | 1,003,800 | — | 0.60% | $4.63B | — | — |
| 2026-04-02 | $27.39 | $27.79 | $27.10 | $27.63 | 1,368,500 | — | 0.82% | $4.59B | $0.76 | — |
| 2026-04-01 | $28.12 | $28.79 | $27.88 | $28.51 | 1,837,100 | — | 1.11% | $4.73B | — | — |
| 2026-03-31 | $27.83 | $28.42 | $27.80 | $28.00 | 1,472,400 | — | 0.89% | $4.65B | — | — |
| 2026-03-30 | $28.51 | $28.57 | $27.00 | $27.28 | 1,482,800 | — | 0.89% | $4.53B | — | — |
| 2026-03-27 | $28.69 | $28.84 | $28.20 | $28.28 | 819,400 | — | 0.49% | $4.69B | — | — |
| 2026-03-26 | $29.08 | $29.40 | $28.72 | $28.84 | 859,400 | — | 0.52% | $4.79B | — | — |
| 2026-03-25 | $29.02 | $29.57 | $28.84 | $29.41 | 971,100 | — | 0.58% | $4.88B | — | — |
| 2026-03-24 | $28.58 | $29.10 | $28.40 | $28.76 | 1,141,100 | — | 0.69% | $4.77B | — | — |
| 2026-03-23 | $28.60 | $29.05 | $28.44 | $28.63 | 1,246,500 | — | 0.75% | $4.75B | — | — |
| 2026-03-20 | $29.07 | $29.32 | $27.69 | $28.25 | 4,818,800 | — | 2.90% | $4.69B | — | — |
| 2026-03-19 | $29.24 | $29.39 | $28.67 | $29.06 | 983,400 | — | 0.59% | $4.82B | — | — |
| 2026-03-18 | $29.32 | $29.83 | $29.32 | $29.50 | 1,206,200 | — | 0.73% | $4.90B | — | — |
| 2026-03-17 | $29.33 | $29.73 | $29.33 | $29.51 | 1,279,500 | — | 0.77% | $4.90B | — | — |
| 2026-03-16 | $28.72 | $29.43 | $28.68 | $29.26 | 1,108,400 | — | 0.67% | $4.86B | — | — |
| 2026-03-13 | $28.98 | $29.22 | $28.18 | $28.30 | 1,208,900 | — | 0.73% | $4.70B | — | — |
| 2026-03-12 | $29.11 | $29.26 | $28.15 | $28.55 | 1,523,100 | — | 0.92% | $4.74B | — | — |
| 2026-03-11 | $29.52 | $29.74 | $29.25 | $29.55 | 1,102,100 | — | 0.66% | $4.91B | — | — |
| 2026-03-10 | $30.05 | $30.46 | $29.50 | $29.60 | 1,057,700 | — | 0.64% | $4.91B | — | — |
| 2026-03-09 | $29.26 | $30.05 | $28.74 | $29.99 | 1,418,300 | — | 0.85% | $4.98B | — | — |
| 2026-03-06 | $30.30 | $30.30 | $29.17 | $29.77 | 1,832,600 | — | 1.10% | $4.94B | — | — |
| 2026-03-05 | $30.68 | $30.89 | $30.51 | $30.66 | 1,737,000 | — | 1.05% | $5.09B | — | — |
| 2026-03-04 | $30.73 | $31.13 | $30.35 | $31.03 | 1,310,700 | — | 0.79% | $5.15B | — | — |
| 2026-03-03 | $30.50 | $30.77 | $29.68 | $30.71 | 1,371,600 | — | 0.83% | $5.10B | — | — |
| 2026-03-02 | $31.00 | $31.15 | $30.10 | $31.00 | 1,898,800 | — | 1.14% | $5.15B | — | — |
| 2026-02-27 | $31.20 | $31.92 | $31.12 | $31.36 | 5,378,700 | — | 3.24% | $5.21B | — | — |
| 2026-02-26 | $30.78 | $31.40 | $30.38 | $31.11 | 1,644,200 | — | 0.99% | $5.16B | — | — |
| 2026-02-25 | $31.00 | $31.19 | $30.50 | $31.00 | 1,677,600 | — | 1.01% | $5.15B | — | — |
| 2026-02-24 | $30.57 | $31.09 | $30.29 | $30.93 | 1,200,600 | — | 0.72% | $5.13B | — | — |
| 2026-02-23 | $31.00 | $31.11 | $30.13 | $30.59 | 1,126,900 | — | 0.68% | $5.08B | — | — |
| 2026-02-20 | $31.00 | $31.41 | $30.78 | $31.05 | 1,233,600 | — | 0.74% | $5.15B | — | — |
| 2026-02-19 | $31.34 | $31.45 | $30.93 | $31.01 | 821,700 | — | 0.49% | $5.15B | — | — |
| 2026-02-18 | $31.57 | $31.84 | $31.36 | $31.38 | 1,357,900 | — | 0.82% | $5.21B | — | — |
| 2026-02-17 | $31.97 | $32.00 | $31.39 | $31.53 | 1,262,800 | — | 0.76% | $5.23B | — | — |
| 2026-02-13 | $31.54 | $32.26 | $31.26 | $31.97 | 1,752,500 | — | 1.06% | $5.31B | — | — |
| 2026-02-12 | $32.13 | $32.60 | $31.43 | $31.45 | 1,884,400 | — | 1.14% | $5.22B | — | — |
| 2026-02-11 | $31.48 | $31.98 | $31.33 | $31.84 | 1,836,400 | — | 1.11% | $5.29B | — | — |
| 2026-02-10 | $31.42 | $31.65 | $31.26 | $31.50 | 1,005,800 | — | 0.61% | $5.23B | — | — |
| 2026-02-09 | $31.57 | $31.62 | $30.96 | $31.38 | 1,281,600 | — | 0.77% | $5.21B | — | — |
| 2026-02-06 | $31.20 | $31.80 | $31.19 | $31.69 | 1,120,700 | — | 0.68% | $5.26B | — | — |
| 2026-02-05 | $30.38 | $31.01 | $30.15 | $31.01 | 1,658,800 | — | 1.00% | $5.15B | — | — |
| 2026-02-04 | $30.09 | $30.74 | $30.04 | $30.43 | 926,900 | — | 0.56% | $5.05B | — | — |
| 2026-02-03 | $29.86 | $30.53 | $29.48 | $29.87 | 1,365,800 | — | 0.82% | $4.96B | — | — |
| 2026-02-02 | $29.80 | $29.99 | $29.42 | $29.61 | 879,600 | — | 0.53% | $4.92B | — | — |
| 2026-01-30 | $29.42 | $30.01 | $29.28 | $29.80 | 1,531,200 | — | 0.92% | $4.95B | — | — |
| 2026-01-29 | $29.64 | $29.77 | $29.39 | $29.70 | 1,342,900 | — | 0.81% | $4.93B | — | — |
| 2026-01-28 | $29.95 | $30.22 | $29.41 | $29.56 | 947,900 | — | 0.57% | $4.91B | — | — |
| 2026-01-27 | $29.81 | $29.99 | $29.68 | $29.81 | 755,400 | — | 0.46% | $4.95B | — | — |
| 2026-01-26 | $30.23 | $30.25 | $29.68 | $29.84 | 717,000 | — | 0.43% | $4.95B | — | — |
| 2026-01-23 | $30.55 | $30.55 | $29.87 | $30.20 | 799,500 | — | 0.48% | $5.01B | — | — |
| 2026-01-22 | $31.43 | $31.43 | $30.54 | $30.63 | 959,500 | — | 0.58% | $5.08B | — | — |
| 2026-01-21 | $30.83 | $31.17 | $30.49 | $31.14 | 1,416,700 | — | 0.85% | $5.17B | — | — |
| 2026-01-20 | $30.73 | $30.98 | $30.45 | $30.58 | 1,021,600 | — | 0.62% | $5.08B | — | — |
| 2026-01-16 | $30.65 | $31.02 | $30.46 | $31.02 | 1,665,200 | — | 1.00% | $5.15B | — | — |
| 2026-01-15 | $30.71 | $30.96 | $30.40 | $30.54 | 942,300 | — | 0.57% | $5.07B | — | — |
| 2026-01-14 | $30.61 | $30.72 | $30.30 | $30.54 | 790,100 | — | 0.48% | $5.07B | — | — |
| 2026-01-13 | $30.44 | $30.97 | $30.40 | $30.60 | 836,000 | — | 0.50% | $5.08B | — | — |
| 2026-01-12 | $30.68 | $31.18 | $30.48 | $30.69 | 1,432,000 | — | 0.86% | $5.09B | — | — |
| 2026-01-09 | $29.25 | $30.98 | $29.24 | $30.83 | 1,559,600 | — | 0.94% | $5.12B | — | — |
| 2026-01-08 | $28.74 | $29.36 | $28.74 | $29.20 | 1,591,400 | — | 0.96% | $4.85B | — | — |
| 2026-01-07 | $29.51 | $29.73 | $28.77 | $28.83 | 1,497,900 | — | 0.90% | $4.79B | — | — |
| 2026-01-06 | $29.23 | $29.56 | $28.50 | $29.56 | 1,552,000 | — | 0.93% | $4.91B | — | — |
| 2026-01-05 | $29.15 | $29.47 | $29.03 | $29.41 | 1,478,400 | — | 0.89% | $4.88B | $0.75 | — |
| 2026-01-02 | $29.78 | $29.97 | $29.51 | $29.83 | 1,414,000 | — | 0.85% | $4.95B | — | — |
| 2025-12-31 | $30.08 | $30.09 | $29.75 | $29.87 | 1,230,800 | — | 0.74% | $4.96B | — | — |
| 2025-12-30 | $29.83 | $30.07 | $29.73 | $30.02 | 1,511,200 | — | 0.91% | $4.98B | — | — |
| 2025-12-29 | $30.42 | $30.42 | $29.84 | $29.90 | 1,496,500 | — | 0.90% | $4.96B | — | — |
| 2025-12-26 | $30.25 | $30.52 | $30.02 | $30.39 | 816,200 | — | 0.49% | $5.04B | — | — |
| 2025-12-24 | $29.98 | $30.26 | $29.85 | $30.09 | 902,400 | — | 0.54% | $5.00B | — | — |
| 2025-12-23 | $29.39 | $30.25 | $29.31 | $29.78 | 1,833,400 | — | 1.10% | $4.94B | — | — |
| 2025-12-22 | $29.44 | $29.61 | $29.00 | $29.11 | 1,701,400 | — | 1.02% | $4.83B | — | — |
| 2025-12-19 | $29.19 | $29.65 | $28.99 | $29.42 | 4,720,300 | — | 2.84% | $4.88B | — | — |
| 2025-12-18 | $30.15 | $30.39 | $29.60 | $29.67 | 2,060,000 | — | 1.24% | $4.93B | — | — |
| 2025-12-17 | $30.97 | $31.13 | $29.73 | $29.78 | 3,514,600 | — | 2.12% | $4.94B | — | — |
| 2025-12-16 | $31.58 | $31.58 | $30.75 | $30.78 | 1,761,200 | — | 1.06% | $5.11B | — | — |
| 2025-12-15 | $31.63 | $31.85 | $31.24 | $31.64 | 1,439,900 | — | 0.87% | $5.25B | — | — |
| 2025-12-12 | $32.00 | $32.01 | $31.65 | $31.70 | 1,187,600 | — | 0.72% | $5.26B | — | — |
| 2025-12-11 | $32.14 | $32.48 | $31.79 | $31.98 | 1,686,100 | — | 1.02% | $5.31B | — | — |
| 2025-12-10 | $31.06 | $32.29 | $30.92 | $32.14 | 3,310,400 | — | 1.99% | $5.34B | — | — |
| 2025-12-09 | $31.10 | $31.51 | $30.97 | $31.00 | 1,954,900 | — | 1.18% | $5.15B | — | — |
| 2025-12-08 | $31.81 | $31.81 | $31.06 | $31.10 | 2,379,600 | — | 1.43% | $5.16B | — | — |
| 2025-12-05 | $31.21 | $31.85 | $30.80 | $31.71 | 2,233,800 | — | 1.35% | $5.26B | — | — |
| 2025-12-04 | $31.98 | $32.00 | $31.41 | $31.52 | 2,074,500 | — | 1.25% | $5.23B | — | — |
| 2025-12-03 | $30.88 | $32.12 | $30.65 | $31.98 | 2,848,200 | — | 1.72% | $5.31B | — | — |
| 2025-12-02 | $30.14 | $30.88 | $29.89 | $30.83 | 4,370,400 | — | 2.63% | $5.12B | — | — |
| 2025-12-01 | $29.79 | $30.61 | $29.65 | $30.23 | 7,378,600 | — | 4.44% | $5.02B | — | — |
| 2025-11-28 | $30.68 | $30.93 | $30.46 | $30.46 | 2,658,800 | — | 1.60% | $5.06B | — | — |
| 2025-11-26 | $31.55 | $31.90 | $30.58 | $30.65 | 4,065,700 | — | 2.45% | $5.09B | — | — |
| 2025-11-25 | $31.37 | $32.26 | $31.11 | $31.72 | 12,549,200 | — | 7.56% | $5.27B | — | — |
| 2025-11-24 | $31.21 | $31.84 | $30.95 | $31.10 | 7,505,600 | — | 4.52% | $5.16B | — | — |
| 2025-11-21 | $29.45 | $31.09 | $29.36 | $30.49 | 6,368,400 | — | 3.84% | $5.06B | — | — |
| 2025-11-20 | $29.14 | $29.72 | $28.77 | $29.24 | 7,678,800 | — | 4.63% | $4.85B | — | — |
| 2025-11-19 | $29.63 | $29.78 | $29.08 | $29.12 | 6,377,700 | — | 3.84% | $4.83B | — | — |
| 2025-11-18 | $29.02 | $29.72 | $28.81 | $29.68 | 4,901,400 | — | 2.95% | $4.93B | — | — |
| 2025-11-17 | $31.24 | $31.31 | $29.07 | $29.50 | 3,782,100 | — | 2.28% | $4.90B | — | — |
| 2025-11-14 | $31.20 | $31.57 | $31.16 | $31.17 | 1,124,900 | — | 0.68% | $5.17B | — | — |
| 2025-11-13 | $31.79 | $31.90 | $31.16 | $31.24 | 1,136,500 | — | 0.68% | $5.19B | — | — |
| 2025-11-12 | $32.19 | $32.53 | $31.79 | $31.79 | 1,512,300 | — | 0.91% | $5.28B | — | — |
| 2025-11-11 | $31.66 | $32.33 | $31.66 | $32.18 | 1,598,000 | — | 0.96% | $5.34B | — | — |
| 2025-11-10 | $31.90 | $31.97 | $31.39 | $31.67 | 1,388,800 | — | 0.84% | $5.26B | — | — |
| 2025-11-07 | $31.10 | $31.84 | $30.96 | $31.83 | 1,220,600 | — | 0.74% | $5.28B | — | — |
| 2025-11-06 | $31.67 | $31.67 | $31.08 | $31.23 | 1,029,100 | — | 0.62% | $5.18B | — | — |
| 2025-11-05 | $31.75 | $32.02 | $31.18 | $31.20 | 2,080,300 | — | 1.25% | $5.18B | — | — |
| 2025-11-04 | $31.32 | $31.87 | $31.19 | $31.87 | 1,417,100 | — | 0.85% | $5.29B | — | — |
| 2025-11-03 | $31.98 | $31.98 | $31.08 | $31.54 | 1,545,600 | — | 0.93% | $5.24B | — | — |
| 2025-10-31 | $32.27 | $32.29 | $31.63 | $32.21 | 1,429,700 | — | 0.86% | $5.35B | — | — |
| 2025-10-30 | $32.29 | $32.54 | $32.02 | $32.38 | 1,394,800 | — | 0.84% | $5.38B | — | — |
| 2025-10-29 | $32.94 | $33.12 | $31.85 | $32.09 | 1,631,500 | — | 0.98% | $5.33B | — | — |
| 2025-10-28 | $32.58 | $32.90 | $32.32 | $32.71 | 993,000 | — | 0.60% | $5.43B | — | — |
| 2025-10-27 | $32.51 | $33.24 | $32.47 | $32.90 | 1,310,300 | — | 0.79% | $5.46B | — | — |
| 2025-10-24 | $33.01 | $33.37 | $32.35 | $32.41 | 1,482,500 | — | 0.89% | $5.38B | — | — |
| 2025-10-23 | $33.49 | $33.49 | $32.17 | $32.80 | 1,578,100 | — | 0.95% | $5.44B | — | — |
| 2025-10-22 | $33.23 | $33.43 | $32.81 | $33.03 | 1,362,600 | — | 0.82% | $5.48B | — | — |
| 2025-10-21 | $32.83 | $33.45 | $32.44 | $33.05 | 1,177,700 | — | 0.71% | $5.49B | — | — |
| 2025-10-20 | $32.84 | $33.03 | $32.59 | $32.84 | 1,098,500 | — | 0.66% | $5.45B | — | — |
| 2025-10-17 | $32.19 | $32.72 | $32.10 | $32.71 | 950,300 | — | 0.57% | $5.43B | — | — |
| 2025-10-16 | $32.03 | $32.32 | $31.89 | $32.29 | 1,353,800 | — | 0.82% | $5.36B | — | — |
| 2025-10-15 | $32.01 | $32.40 | $31.60 | $32.08 | 1,559,600 | — | 0.94% | $5.33B | — | — |
| 2025-10-14 | $31.08 | $31.90 | $30.96 | $31.51 | 1,134,800 | — | 0.68% | $5.23B | — | — |
| 2025-10-13 | $31.47 | $31.85 | $30.71 | $31.08 | 2,079,900 | — | 1.25% | $5.16B | — | — |
| 2025-10-10 | $31.69 | $31.98 | $30.30 | $31.23 | 4,134,500 | — | 2.49% | $5.18B | — | — |
| 2025-10-09 | $32.70 | $33.00 | $32.06 | $32.39 | 1,016,400 | — | 0.61% | $5.38B | — | — |
| 2025-10-08 | $32.34 | $33.06 | $32.24 | $32.69 | 1,604,600 | — | 0.97% | $5.43B | — | — |
| 2025-10-07 | $31.83 | $32.79 | $31.59 | $32.01 | 2,027,100 | — | 1.22% | $5.31B | — | — |
| 2025-10-06 | $32.18 | $32.31 | $31.33 | $31.87 | 1,302,300 | — | 0.78% | $5.29B | — | — |
| 2025-10-03 | $32.36 | $32.54 | $32.15 | $32.18 | 1,347,900 | — | 0.81% | $5.34B | $0.73 | — |
| 2025-10-02 | $33.60 | $34.03 | $32.94 | $33.02 | 1,385,300 | — | 0.83% | $5.48B | — | — |
| 2025-10-01 | $33.50 | $33.97 | $33.39 | $33.58 | 1,865,000 | — | 1.12% | $5.57B | — | — |
| 2025-09-30 | $33.92 | $33.93 | $33.42 | $33.61 | 896,900 | — | 0.54% | $5.58B | — | — |
| 2025-09-29 | $34.14 | $34.14 | $33.53 | $33.86 | 1,628,800 | — | 0.98% | $5.62B | — | — |
| 2025-09-26 | $34.45 | $34.51 | $33.91 | $34.03 | 1,445,200 | — | 0.87% | $5.65B | — | — |
| 2025-09-25 | $34.48 | $34.63 | $34.01 | $34.45 | 771,300 | — | 0.46% | $5.72B | — | — |
| 2025-09-24 | $34.52 | $34.70 | $34.33 | $34.44 | 764,600 | — | 0.46% | $5.72B | — | — |
| 2025-09-23 | $34.35 | $35.10 | $34.31 | $34.61 | 974,000 | — | 0.59% | $5.75B | — | — |
| 2025-09-22 | $34.55 | $34.55 | $33.88 | $34.07 | 761,200 | — | 0.46% | $5.66B | — | — |
| 2025-09-19 | $34.96 | $34.96 | $34.11 | $34.35 | 3,023,700 | — | 1.82% | $5.70B | — | — |
| 2025-09-18 | $34.18 | $34.83 | $34.08 | $34.63 | 807,200 | — | 0.49% | $5.75B | — | — |
| 2025-09-17 | $34.51 | $34.97 | $34.08 | $34.17 | 837,800 | — | 0.50% | $5.67B | — | — |
| 2025-09-16 | $35.12 | $35.45 | $34.33 | $34.61 | 1,189,200 | — | 0.72% | $5.75B | — | — |
| 2025-09-15 | $34.72 | $35.37 | $34.41 | $35.20 | 1,376,200 | — | 0.83% | $5.84B | — | — |
| 2025-09-12 | $34.85 | $35.02 | $34.59 | $34.64 | 813,300 | — | 0.49% | $5.75B | — | — |
| 2025-09-11 | $35.08 | $35.17 | $34.57 | $34.84 | 920,300 | — | 0.55% | $5.78B | — | — |
| 2025-09-10 | $35.08 | $35.28 | $34.87 | $34.91 | 596,400 | — | 0.36% | $5.80B | — | — |
| 2025-09-09 | $34.43 | $35.01 | $34.17 | $35.00 | 1,042,700 | — | 0.63% | $5.81B | — | — |
| 2025-09-08 | $33.99 | $34.43 | $33.83 | $34.28 | 1,395,200 | — | 0.84% | $5.69B | — | — |
| 2025-09-05 | $34.23 | $34.66 | $34.18 | $34.21 | 832,700 | — | 0.50% | $5.68B | — | — |
| 2025-09-04 | $34.55 | $34.72 | $34.11 | $34.23 | 1,033,000 | — | 0.62% | $5.68B | — | — |
| 2025-09-03 | $34.19 | $34.77 | $34.09 | $34.55 | 2,093,700 | — | 1.26% | $5.74B | — | — |
| 2025-09-02 | $35.09 | $35.33 | $33.84 | $34.15 | 1,813,400 | — | 1.09% | $5.67B | — | — |
| 2025-08-29 | $35.50 | $35.58 | $35.00 | $35.31 | 1,414,200 | — | 0.85% | $5.86B | — | — |
| 2025-08-28 | $35.39 | $36.00 | $35.37 | $35.50 | 1,110,600 | — | 0.67% | $5.89B | — | — |
| 2025-08-27 | $35.05 | $35.46 | $34.88 | $35.39 | 626,200 | — | 0.38% | $5.87B | — | — |
| 2025-08-26 | $34.85 | $35.23 | $34.73 | $35.17 | 900,700 | — | 0.54% | $5.84B | — | — |
| 2025-08-25 | $34.21 | $34.75 | $34.19 | $34.72 | 809,500 | — | 0.49% | $5.76B | — | — |
| 2025-08-22 | $33.37 | $34.56 | $33.32 | $34.30 | 998,700 | — | 0.60% | $5.69B | — | — |
| 2025-08-21 | $32.50 | $33.38 | $32.39 | $33.34 | 746,300 | — | 0.45% | $5.53B | — | — |
| 2025-08-20 | $32.54 | $32.79 | $32.30 | $32.69 | 879,500 | — | 0.53% | $5.43B | — | — |
| 2025-08-19 | $31.68 | $32.55 | $31.63 | $32.55 | 794,500 | — | 0.48% | $5.40B | — | — |
| 2025-08-18 | $31.72 | $32.04 | $31.55 | $31.81 | 1,598,400 | — | 0.96% | $5.28B | — | — |
| 2025-08-15 | $32.14 | $32.21 | $31.50 | $31.74 | 1,022,200 | — | 0.62% | $5.27B | — | — |
| 2025-08-14 | $32.33 | $32.45 | $31.98 | $32.09 | 1,161,000 | — | 0.70% | $5.33B | — | — |
| 2025-08-13 | $31.83 | $32.60 | $31.64 | $32.40 | 1,600,500 | — | 0.96% | $5.38B | — | — |
| 2025-08-12 | $31.26 | $31.76 | $31.05 | $31.76 | 1,157,100 | — | 0.70% | $5.27B | — | — |
| 2025-08-11 | $31.26 | $31.57 | $31.09 | $31.16 | 1,004,000 | — | 0.60% | $5.17B | — | — |
| 2025-08-08 | $31.33 | $31.61 | $31.15 | $31.34 | 890,500 | — | 0.54% | $5.20B | — | — |
| 2025-08-07 | $31.38 | $31.74 | $31.25 | $31.34 | 795,500 | — | 0.48% | $5.20B | — | — |
| 2025-08-06 | $31.26 | $31.79 | $31.05 | $31.63 | 1,165,800 | — | 0.70% | $5.25B | — | — |
| 2025-08-05 | $30.56 | $31.32 | $30.33 | $31.26 | 1,503,500 | — | 0.91% | $5.19B | — | — |
| 2025-08-04 | $30.11 | $30.62 | $29.92 | $30.32 | 698,900 | — | 0.42% | $5.03B | — | — |
| 2025-08-01 | $30.54 | $30.84 | $29.73 | $29.94 | 980,300 | — | 0.59% | $4.97B | — | — |
| 2025-07-31 | $31.15 | $31.56 | $29.98 | $29.99 | 841,000 | — | 0.51% | $4.98B | — | — |
| 2025-07-30 | $30.86 | $31.08 | $30.47 | $30.54 | 865,600 | — | 0.52% | $5.07B | — | — |
| 2025-07-29 | $30.81 | $30.98 | $30.60 | $30.75 | 851,200 | — | 0.51% | $5.10B | — | — |
| 2025-07-28 | $31.00 | $31.00 | $30.64 | $30.80 | 557,800 | — | 0.34% | $5.11B | — | — |
| 2025-07-25 | $30.95 | $31.23 | $30.56 | $30.94 | 562,600 | — | 0.34% | $5.14B | — | — |
| 2025-07-24 | $31.27 | $31.33 | $30.73 | $30.75 | 625,900 | — | 0.38% | $5.10B | — | — |
| 2025-07-23 | $31.35 | $31.48 | $30.94 | $31.27 | 877,600 | — | 0.53% | $5.19B | — | — |
| 2025-07-22 | $30.85 | $31.44 | $30.78 | $31.22 | 1,012,700 | — | 0.61% | $5.18B | — | — |
| 2025-07-21 | $30.90 | $31.31 | $30.76 | $30.93 | 1,041,400 | — | 0.63% | $5.13B | — | — |
| 2025-07-18 | $30.90 | $31.02 | $30.38 | $30.68 | 1,025,100 | — | 0.62% | $5.09B | — | — |
| 2025-07-17 | $30.62 | $31.07 | $30.62 | $30.73 | 999,500 | — | 0.60% | $5.10B | — | — |
| 2025-07-16 | $30.43 | $30.99 | $30.28 | $30.76 | 1,391,500 | — | 0.84% | $5.11B | — | — |
| 2025-07-15 | $30.14 | $30.75 | $30.09 | $30.20 | 1,488,600 | — | 0.90% | $5.01B | — | — |
| 2025-07-14 | $30.07 | $30.67 | $30.00 | $30.25 | 1,300,300 | — | 0.78% | $5.02B | — | — |
| 2025-07-11 | $29.35 | $30.00 | $29.31 | $29.87 | 1,091,300 | — | 0.66% | $4.96B | — | — |
| 2025-07-10 | $29.33 | $29.94 | $29.16 | $29.50 | 1,435,900 | — | 0.86% | $4.90B | — | — |
| 2025-07-09 | $27.62 | $29.37 | $27.61 | $28.96 | 2,676,900 | — | 1.61% | $4.81B | — | — |
| 2025-07-08 | $27.88 | $28.33 | $27.47 | $27.51 | 1,203,400 | — | 0.72% | $4.57B | — | — |
| 2025-07-07 | $28.02 | $28.35 | $27.78 | $28.04 | 929,800 | — | 0.56% | $4.65B | — | — |
| 2025-07-03 | $28.11 | $28.37 | $27.93 | $28.03 | 714,100 | — | 0.43% | $4.65B | $0.69 | — |
| 2025-07-02 | $28.46 | $28.92 | $28.20 | $28.88 | 1,208,200 | — | 0.73% | $4.79B | — | — |
| 2025-07-01 | $28.40 | $28.84 | $28.40 | $28.59 | 1,250,000 | — | 0.75% | $4.75B | — | — |
| 2025-06-30 | $28.77 | $28.91 | $28.36 | $28.51 | 1,664,300 | — | 1.00% | $4.73B | — | — |
| 2025-06-27 | $28.35 | $28.75 | $28.19 | $28.72 | 2,242,600 | — | 1.35% | $4.77B | — | — |
| 2025-06-26 | $27.80 | $28.31 | $27.53 | $28.27 | 719,300 | — | 0.43% | $4.69B | — | — |
| 2025-06-25 | $28.60 | $28.65 | $27.84 | $27.92 | 526,900 | — | 0.32% | $4.63B | — | — |
| 2025-06-24 | $28.26 | $28.79 | $28.10 | $28.67 | 743,500 | — | 0.45% | $4.76B | — | — |
| 2025-06-23 | $28.30 | $28.62 | $27.91 | $28.22 | 822,600 | — | 0.50% | $4.68B | — | — |
| 2025-06-20 | $28.30 | $28.57 | $28.01 | $28.43 | 3,383,700 | — | 2.04% | $4.72B | — | — |
| 2025-06-18 | $27.75 | $28.45 | $27.62 | $28.21 | 807,700 | — | 0.49% | $4.68B | — | — |
| 2025-06-17 | $27.41 | $28.03 | $27.37 | $27.80 | 1,165,800 | — | 0.70% | $4.61B | — | — |
| 2025-06-16 | $27.26 | $27.69 | $27.11 | $27.33 | 998,600 | — | 0.60% | $4.54B | — | — |
| 2025-06-13 | $27.16 | $27.38 | $26.91 | $27.20 | 618,700 | — | 0.37% | $4.52B | — | — |
| 2025-06-12 | $27.60 | $27.92 | $27.19 | $27.34 | 520,700 | — | 0.31% | $4.54B | — | — |
| 2025-06-11 | $27.96 | $28.29 | $27.57 | $27.63 | 640,500 | — | 0.39% | $4.59B | — | — |
| 2025-06-10 | $27.78 | $28.01 | $27.62 | $27.93 | 606,700 | — | 0.37% | $4.64B | — | — |
| 2025-06-09 | $27.82 | $27.92 | $27.51 | $27.76 | 481,900 | — | 0.29% | $4.61B | — | — |
| 2025-06-06 | $27.68 | $27.91 | $27.54 | $27.64 | 511,200 | — | 0.31% | $4.59B | — | — |
| 2025-06-05 | $27.70 | $27.98 | $27.44 | $27.48 | 610,100 | — | 0.37% | $4.56B | — | — |
| 2025-06-04 | $27.80 | $27.97 | $27.62 | $27.78 | 784,600 | — | 0.47% | $4.61B | — | — |
| 2025-06-03 | $27.72 | $27.93 | $27.51 | $27.83 | 790,000 | — | 0.48% | $4.62B | — | — |
| 2025-06-02 | $27.73 | $28.01 | $27.45 | $27.68 | 710,200 | — | 0.43% | $4.59B | — | — |
| 2025-05-30 | $27.79 | $27.92 | $27.48 | $27.87 | 1,556,500 | — | 0.94% | $4.63B | — | — |
| 2025-05-29 | $27.57 | $27.95 | $27.42 | $27.88 | 602,700 | — | 0.36% | $4.63B | — | — |
| 2025-05-28 | $27.79 | $27.92 | $27.46 | $27.57 | 680,100 | — | 0.41% | $4.58B | — | — |
| 2025-05-27 | $28.30 | $28.40 | $27.72 | $27.87 | 716,300 | — | 0.43% | $4.63B | — | — |
| 2025-05-23 | $27.82 | $28.20 | $27.76 | $28.03 | 725,000 | — | 0.44% | $4.65B | — | — |
| 2025-05-22 | $28.14 | $28.34 | $27.66 | $28.03 | 1,486,200 | — | 0.90% | $4.65B | — | — |
| 2025-05-21 | $28.42 | $28.99 | $28.10 | $28.11 | 1,003,600 | — | 0.60% | $4.67B | — | — |
| 2025-05-20 | $28.72 | $28.79 | $28.38 | $28.61 | 774,200 | — | 0.47% | $4.75B | — | — |
| 2025-05-19 | $28.14 | $28.73 | $28.04 | $28.70 | 812,400 | — | 0.49% | $4.76B | — | — |
| 2025-05-16 | $28.63 | $28.74 | $28.18 | $28.61 | 1,073,700 | — | 0.65% | $4.75B | — | — |
| 2025-05-15 | $27.84 | $28.80 | $27.84 | $28.63 | 1,067,300 | — | 0.64% | $4.75B | — | — |
| 2025-05-14 | $27.08 | $28.90 | $27.00 | $27.81 | 2,088,700 | — | 1.26% | $4.62B | — | — |
| 2025-05-13 | $26.57 | $26.73 | $26.03 | $26.64 | 1,480,500 | — | 0.89% | $4.42B | — | — |
| 2025-05-12 | $26.06 | $26.44 | $25.62 | $26.29 | 890,700 | — | 0.54% | $4.36B | — | — |
| 2025-05-09 | $26.19 | $26.40 | $25.22 | $25.32 | 2,065,700 | — | 1.24% | $4.20B | — | — |
| 2025-05-08 | $25.52 | $26.12 | $25.39 | $26.02 | 827,200 | — | 0.50% | $4.32B | — | — |
| 2025-05-07 | $25.77 | $25.86 | $25.37 | $25.42 | 1,662,200 | — | 1.00% | $4.22B | — | — |
| 2025-05-06 | $25.66 | $25.89 | $25.62 | $25.78 | 537,600 | — | 0.32% | $4.28B | — | — |
| 2025-05-05 | $25.75 | $26.20 | $25.55 | $25.84 | 785,400 | — | 0.47% | $4.29B | — | — |
| 2025-05-02 | $25.68 | $25.93 | $25.52 | $25.84 | 702,300 | — | 0.42% | $4.29B | — | — |
| 2025-05-01 | $25.22 | $25.59 | $25.00 | $25.39 | 834,200 | — | 0.50% | $4.21B | — | — |
| 2025-04-30 | $24.84 | $25.14 | $24.60 | $25.04 | 949,700 | — | 0.57% | $4.16B | — | — |
| 2025-04-29 | $25.01 | $25.16 | $24.65 | $25.00 | 716,200 | — | 0.43% | $4.15B | — | — |
| 2025-04-28 | $24.94 | $25.23 | $24.78 | $25.02 | 610,300 | — | 0.37% | $4.15B | — | — |
| 2025-04-25 | $25.19 | $25.20 | $24.63 | $24.84 | 612,700 | — | 0.37% | $4.12B | — | — |
| 2025-04-24 | $24.81 | $25.14 | $24.49 | $25.04 | 733,800 | — | 0.44% | $4.16B | — | — |
| 2025-04-23 | $24.79 | $25.18 | $24.40 | $24.53 | 1,202,400 | — | 0.72% | $4.07B | — | — |
| 2025-04-22 | $23.90 | $24.43 | $23.69 | $24.40 | 1,082,500 | — | 0.65% | $4.05B | — | — |
| 2025-04-21 | $23.64 | $23.99 | $23.01 | $23.52 | 1,238,900 | — | 0.75% | $3.90B | — | — |
| 2025-04-17 | $23.40 | $24.13 | $23.40 | $23.92 | 884,700 | — | 0.53% | $3.97B | — | — |
| 2025-04-16 | $23.81 | $24.08 | $23.34 | $23.40 | 671,300 | — | 0.40% | $3.88B | — | — |
| 2025-04-15 | $23.45 | $23.96 | $23.33 | $23.75 | 952,300 | — | 0.57% | $3.94B | — | — |
| 2025-04-14 | $23.74 | $24.22 | $23.42 | $23.60 | 1,099,400 | — | 0.66% | $3.92B | — | — |
| 2025-04-11 | $22.70 | $23.40 | $22.20 | $23.31 | 1,139,000 | — | 0.69% | $3.87B | — | — |
| 2025-04-10 | $23.41 | $23.53 | $22.58 | $22.77 | 1,160,800 | — | 0.70% | $3.78B | — | — |
| 2025-04-09 | $21.90 | $24.00 | $21.64 | $23.64 | 2,569,700 | — | 1.55% | $3.92B | — | — |
| 2025-04-08 | $23.75 | $24.07 | $22.17 | $22.51 | 1,904,900 | — | 1.15% | $3.74B | — | — |
| 2025-04-07 | $23.38 | $24.54 | $22.80 | $23.55 | 1,904,600 | — | 1.15% | $3.91B | — | — |
| 2025-04-04 | $24.88 | $24.91 | $23.80 | $23.94 | 2,372,500 | — | 1.43% | $3.97B | $0.38 | — |
| 2025-04-03 | $25.81 | $26.20 | $25.43 | $25.67 | 1,816,700 | — | 1.09% | $4.26B | — | — |
| 2025-04-02 | $25.75 | $26.71 | $25.60 | $26.50 | 1,267,800 | — | 0.76% | $4.40B | — | — |
| 2025-04-01 | $26.34 | $26.48 | $25.85 | $26.00 | 1,038,600 | — | 0.63% | $4.32B | — | — |
| 2025-03-31 | $26.25 | $26.65 | $25.92 | $26.51 | 1,169,200 | — | 0.70% | $4.40B | — | — |
| 2025-03-28 | $26.63 | $26.70 | $26.06 | $26.52 | 1,442,600 | — | — | — | — | — |
| 2025-03-27 | $25.65 | $26.65 | $25.41 | $26.42 | 1,564,500 | — | — | — | — | — |
| 2025-03-26 | $26.27 | $26.99 | $25.83 | $25.85 | 1,611,300 | — | — | — | — | — |
| 2025-03-25 | $26.10 | $26.64 | $25.92 | $26.12 | 2,133,800 | — | — | — | — | — |
| 2025-03-24 | $25.42 | $26.28 | $25.23 | $26.19 | 2,128,800 | — | — | — | — | — |
| 2025-03-21 | $24.75 | $25.41 | $24.38 | $25.35 | 10,986,800 | — | — | — | — | — |
| 2025-03-20 | $25.04 | $25.81 | $24.56 | $24.67 | 2,951,300 | — | — | — | — | — |
| 2025-03-19 | $24.38 | $26.17 | $24.12 | $25.39 | 2,738,100 | — | — | — | — | — |
| 2025-03-18 | $22.90 | $24.89 | $22.90 | $24.24 | 5,626,600 | — | — | — | — | — |
| 2025-03-17 | $21.66 | $22.25 | $21.42 | $22.00 | 1,322,100 | — | — | — | — | — |
| 2025-03-14 | $21.69 | $22.16 | $21.28 | $21.74 | 1,326,300 | — | — | — | — | — |
| 2025-03-13 | $21.79 | $21.84 | $21.02 | $21.37 | 2,583,300 | — | — | — | — | — |
| 2025-03-12 | $21.23 | $21.95 | $21.21 | $21.80 | 1,879,800 | — | — | — | — | — |
| 2025-03-11 | $21.65 | $21.86 | $21.13 | $21.22 | 1,517,300 | — | — | — | — | — |
| 2025-03-10 | $21.70 | $22.28 | $21.50 | $21.62 | 1,641,400 | — | — | — | — | — |
| 2025-03-07 | $21.80 | $22.36 | $21.40 | $21.97 | 1,395,600 | — | — | — | — | — |
| 2025-03-06 | $22.22 | $22.68 | $21.50 | $21.79 | 1,529,600 | — | — | — | — | — |
| 2025-03-05 | $22.01 | $22.65 | $22.00 | $22.39 | 1,310,900 | — | — | — | — | — |
| 2025-03-04 | $22.12 | $22.62 | $21.80 | $22.19 | 1,579,600 | — | — | — | — | — |
| 2025-03-03 | $22.52 | $23.14 | $22.15 | $22.24 | 3,309,800 | — | — | — | — | — |
| 2025-02-28 | $22.41 | $22.88 | $22.20 | $22.86 | 1,701,100 | — | — | — | — | — |
| 2025-02-27 | $22.78 | $23.00 | $21.92 | $22.59 | 1,312,100 | — | — | — | — | — |
| 2025-02-26 | $22.64 | $22.66 | $22.21 | $22.25 | 2,103,200 | — | — | — | — | — |
| 2025-02-25 | $22.88 | $23.15 | $22.29 | $22.60 | 3,025,800 | — | — | — | — | — |
| 2025-02-24 | $23.81 | $23.90 | $23.08 | $23.19 | 2,641,700 | — | — | — | — | — |
| 2025-02-21 | $23.64 | $24.14 | $23.36 | $23.80 | 2,252,100 | — | — | — | — | — |
| 2025-02-20 | $23.34 | $23.74 | $23.10 | $23.50 | 1,523,400 | — | — | — | — | — |
| 2025-02-19 | $23.99 | $23.99 | $23.06 | $23.50 | 3,066,700 | — | — | — | — | — |
| 2025-02-18 | $22.63 | $23.29 | $22.20 | $23.25 | 5,514,500 | — | — | — | — | — |
| 2025-02-14 | $23.00 | $23.64 | $22.55 | $22.92 | 5,650,100 | — | — | — | — | — |
| 2025-02-13 | $21.57 | $22.94 | $21.57 | $22.72 | 5,841,700 | — | — | — | — | — |
| 2025-02-12 | $22.00 | $22.69 | $21.75 | $21.79 | 7,847,400 | — | — | — | — | — |
| 2025-02-11 | $22.08 | $23.23 | $21.74 | $22.50 | 13,758,100 | — | — | — | — | — |
| 2025-02-10 | $25.70 | $25.95 | $22.89 | $23.01 | 15,682,700 | — | — | — | — | — |
| 2025-02-07 | $23.49 | $27.07 | $22.26 | $26.74 | 41,730,700 | — | — | — | — | — |
Close is split-adjusted to current shares. It is not dividend-adjusted: dividends are listed separately, so total return is (end price + dividends received − start price) ÷ start price, checkable by hand. Volume is as-traded.
Momentum: MACD and RSI
Top: MACD (navy) and its signal line (gold); bars show the gap between them, teal when MACD is above.
Bottom: RSI over 14 days; above 70 is usually read as overbought and below 30 as oversold.
The lines start late because MACD needs 26 trading days of prices and RSI 14 before the first value.
The colored strip under the charts shows the state label day by day; hover for the state and the reason.
Both measure momentum in the price and say nothing about value. Hover for each day's arithmetic.
Source: closing prices from this site's daily price archive (Yahoo Finance), not adjusted for dividends. Data through Nov 14, 2026.
How these are calculated
Short Selling
Bars: shares sold short each day in trades reported to FINRA (off-exchange
trades, roughly half of all volume).
Line: the short share of that volume, averaged over 20 sessions.
Gold points: short interest, the shares sold short and not yet bought back,
reported twice a month, also shown as a percentage of the free float and of
shares outstanding.
Daily short volume includes market makers' routine hedging, so a change in the
share is more informative than its level. Hover for each day's figures.
Sources: FINRA; float from this site's daily share records; shares outstanding
from the company's latest quarterly filing. Data through Nov 13, 2026.
Index-Fund Holdings
Daily positions of State Street's SPDR index funds, by the fund's file date.
These are the index funds whose daily holdings can be collected; iShares and
Vanguard funds, often larger holders, publish holdings that cannot be
collected automatically and appear in the written analysis from their
quarterly filings.
Collection began on October 11, 2026. A fund that drops the stock shows as an
exit.
Source: State Street Global Advisors. Data through
Nov 12, 2026.
Update — November 5, 2026: the 10-Q and the watch — HOLD, watch lifted, target $25
Written against the November 4, 2026 close of $26.93. Source: the third-quarter 10-Q, filed after the close on November 4, 2026. The analyses below are left as published. This section reviews the watch on the 10-Q, as the October 30, 2026 update said it would. The scenarios and the target are unchanged.
The 10-Q answers one of the three remaining questions:
| Question | Answered | What the 10-Q says |
|---|---|---|
| Who approved the purchases | No | Its related-party note covers only the manager, Kennedy Lewis ($30.3 million of fees in the third quarter). It states that Lennar stopped being a related party when Lennar’s exchange offer closed on November 28, 2025, so purchases from Lennar carry no related-party disclosure, although Lennar’s executive chairman controls 43% of Millrose’s votes |
| How the homes were priced | No | $318.5 million for the 1,233 homes plus $14.1 million of acquisition and preparation costs; no yield, appraisal or market comparison |
| Whether the program is capped | In part | No growth beyond the program already disclosed: the further contracts are 620 homes from Lennar for $150.3 million, about $50 million of Millrose’s own money after limited-recourse financing, and Millrose may lose its deposits if it does not buy them. That takes the program to about $483 million gross, 4.6% of total assets of $10.56 billion. No limit is stated, and the rental-home credit line, $235 million committed with $213 million drawn, can grow to $1.0 billion if the lenders agree |
The watch is lifted. The filings will not say more on approval or pricing, and the purpose of the watch, to stop the signals while the size of the program was unknown, is met: the program is sized at about $483 million gross and $170 million of Millrose’s own money, and the cost of a bad price on all of it is about $0.70 a share (an estimate, from the October 30, 2026 update). The governance question stays open and is now part of the rating. The header chips return.
HOLD, target $25. At $26.93 the best-guess value, $25.40, is 5.7% below the price, inside the HOLD band. The condition published for ACCUMULATE, that the rental program be explained and capped, is not met, so the stock would not move up a band on price alone until the company discloses who approved the purchases and on what terms, or states a limit. A further purchase from Lennar beyond the 620 homes, or a draw on the rental credit line beyond the $235 million committed, would count against the rating.
Update — October 30, 2026: third-quarter results and the home purchases — HOLD, on watch until the 10-Q, target $25
Written against the October 30, 2026 close of $25.62. Sources: the results release and presentation of October 27, 2026. The analyses below are left as published. This section tests the results against the four questions that put the stock on watch on October 13, 2026. The rating, the scenarios and the target are unchanged.
The results answered two of the four questions:
| Question | Answered | What the results say |
|---|---|---|
| How large is the program | Yes | 1,233 completed Lennar homes in 18 states, mostly Texas, Florida and the Carolinas, for about $333 million: $120 million of Millrose’s money and $213 million of limited-recourse debt at SOFR plus 1.20%. The $120 million is about 2% of shareholders’ equity |
| How the homes were priced | In part | About $270,000 a home, with the cost by state. No initial yield, appraisal or comparison with Lennar’s retail prices was given, so whether Millrose paid a market price cannot be tested |
| Who approved the purchases | No | Neither the release nor the presentation says whether the independent directors approved them |
| Whether the program is capped | No | It is called a pilot, but Millrose has also signed build-to-rent contracts of about $150 million (about $50 million of its own money), which takes the program to about $480 million gross and $170 million net |
The rest of the quarter reduced Millrose’s dependence on Lennar. With a $1.1 billion financing for Dream Finders’ purchase of Beazer Homes, completed October 20, 2026, about 42% of assets are outside the Lennar program. Adjusted funds from operations were $0.80 a share, the outlook was raised to $0.82–0.84 a quarter, and the board authorized a first buyback of $250 million. The rental homes are excluded from the manager’s fee.
The amount at stake is small, and the governance question is unanswered. Even if Millrose had overpaid by a quarter on the whole $480 million, the cost would be about $0.70 a share (an estimate). The watch rests on whether Millrose deals with Lennar at arm’s length, since Lennar’s chairman controls 43% of its votes, and the approval and the pricing basis are exactly what is missing.
The watch is extended to the third-quarter 10-Q, due by November 9, 2026, whose related-party note is the next place these would be disclosed. It will be lifted if the 10-Q shows approval by the independent directors or the audit committee, a pricing basis at or below market, and no growth beyond the program disclosed. If the 10-Q is silent, the watch will be reviewed on that filing. The shares rose 7.2% from the close before the results to $25.62, against the target of $25; the rating stays HOLD, and the condition of no new position while on watch stands.
Update — October 13, 2026: the asymmetry, short interest and volatility — HOLD, on watch, target $25
Written against the October 12, 2026 close of $22.28. Source: the three scenarios of the October 11, 2026 analysis below, unchanged, and FINRA short-interest data. The analysis below is left as published; this section sets the scenario weights on the evidence, adds the asymmetry measures, short interest and volatility, and places the stock on watch until the third-quarter results. The rating is unchanged; the target moves from $26 to $25 because the weights change.
The one-line version
Millrose stays at HOLD and goes on watch until the October 27, 2026 results, whatever the valuation says. The purchases of finished Lennar homes to rent change the business model, and they suggest Millrose is acting as an extension of Lennar’s balance sheet, which undermines the case for owning it as an independent land bank. On the numbers alone the stock looks attractive: weighted 15% best, 60% base and 25% worst, it is worth about $25, an expected return of 14% with $3.20 of probability-weighted gain for each $1 of loss, and the price implies no chance of the best case and a 42% chance of the worst. Short interest is the highest since the spin, at 5.5% of the float.
The scenarios and the asymmetry
The three cases are the ones built on October 11, 2026, valued by discounting dividends at each case’s cost of equity: best $35.86, base $26.44 and worst $16.61, against $22.28 (+61%, +19% and −25%).
Three weightings, and what the price implies. The standard set, 25 / 50 / 25, and the stress set, 10 / 40 / 50, are the same for every company; the best guess is set from the evidence and drives the target and the two chips at the top of the page.
| Weights, best / base / worst | Value | Expected return | Gain to loss |
|---|---|---|---|
| Standard: 25 / 50 / 25 | $26.34 | +18% | 3.9 to 1 |
| Best guess: 15 / 60 / 25 | $25.40 | +14% | 3.2 to 1 |
| Stress: 10 / 40 / 50 | $22.47 | +1% | 1.1 to 1 |
| What the price implies: 0 / 58 / 42 | $22.28 | 0% | 1.0 to 1 |
The weights are a judgement. All values are estimates from the model.
Why the best guess. The analysis below estimated a 15% chance that rates fall back and the rental program is shut or kept small and disclosed, which is the best case, so it gets 15%. On the downside it estimated 15% for rental purchases that prove to be supporting Lennar at a loss, worth about $19–21, and 10% for a housing recession with builders walking away, the worst case. The rental outcome is the more likely of the two and the harder to bound, since it bears on whether Millrose is run for its own shareholders, so the worst case gets 25%. The base case takes the remaining 60%.
What the price implies. Holding the base case at 60% cannot reproduce $22.28: even with no weight on the best case, 60% base and 40% worst is worth $22.51. With the best case at zero, the price is matched by the base and worst split that solves
base weight × $26.44 + (100% − base weight) × $16.61 = $22.28
which gives a base weight of ($22.28 − $16.61) ÷ ($26.44 − $16.61) = 58%, and so 42% on the worst case. The market gives the worst case about twice the weight the evidence supports, and no weight to a return to book value. The same reverse calculation on a single assumption gives the base-case dividends discounted at about 14.8%, as the analysis below found at $22.36.
The asymmetry on the best guess:
| Measure | At $22.28 | What it means |
|---|---|---|
| Expected return (header chip) | +14% | The probability-weighted value, $25.40, against the price |
| Gain to loss (header chip) | 3.2 to 1 | +$4.53 of probability-weighted gain against −$1.42 of loss |
| Expected base-case gain ÷ expected worst-case loss | 1.8 to 1 | +$2.50 against −$1.42: the likely outcome pays for the bad one without the best case |
| Best-case gain ÷ worst-case loss | 2.4 to 1 | +$13.58 against −$5.67 |
| Base-case gain ÷ worst-case loss | 0.7 to 1 | +$4.16 against −$5.67 |
How the measures are calculated. Gain = case value − price; loss = price − case value. Weights are the best guess: 15% best, 60% base, 25% worst.
| Measure | Formula | At $22.28 |
|---|---|---|
| Expected return | (15% × best + 60% × base + 25% × worst) ÷ price − 1 | ($5.38 + $15.86 + $4.15) ÷ $22.28 − 1 = +14% |
| Gain to loss | (15% × best gain + 60% × base gain) ÷ (25% × worst loss) | ($2.04 + $2.50) ÷ $1.42 = 3.2 |
| Expected base ÷ expected worst | (60% × base gain) ÷ (25% × worst loss) | $2.50 ÷ $1.42 = 1.8 |
| Best ÷ worst | best gain ÷ worst loss | $13.58 ÷ $5.67 = 2.4 |
| Base ÷ worst | base gain ÷ worst loss | $4.16 ÷ $5.67 = 0.7 |
| Price-implied base weight, best at zero | (price − worst) ÷ (base − worst) | ($22.28 − $16.61) ÷ $9.83 = 58% |
The header chips are green at +25% or more and 3 to 1 or better, blue at +10–25% and 2–3 to 1, orange at 0–10% and 1–2 to 1, and red below zero and below 1 to 1. On the best guess, expected return is green below $20.32, blue up to $23.09 and orange up to $25.40; gain to loss is green below $22.47, blue up to $23.64 and orange up to $25.40. While the stock is on watch both chips are shown in grey.
Why the stock is on watch
The case for Millrose was an independent land bank: a REIT that buys land, lends it to builders under option contracts, and is protected by deposits and by the builders’ need to keep their options. Buying finished Lennar homes to rent is a different business, with different returns and risks, and it was begun without an announcement. It also suggests that Millrose is being used as an off-balance-sheet extension of Lennar, its largest counterparty, whose chairman controls 43% of Millrose’s votes, which would mean decisions are made for Lennar’s benefit as much as for Millrose’s shareholders. If that is so, the investment case fails at any price, because the valuation assumes contracts negotiated at arm’s length. So the valuation is set aside until the October 27, 2026 results, which need to disclose the program’s size, pricing and approval by the independent directors, and cap it. The chips at the top of the page are greyed out until then, and the action table below gains one condition: no new position before those results, whatever the price.
Short interest and volatility
The tables below show how much of the stock is sold short and how much the price moves. They are inputs to the weights above, and the tables update with the nightly data.
| Report | Settled | Short | % float | % outst. | Days to cover |
|---|---|---|---|---|---|
| First after the spin | Feb 14, 2025 | 5.05M | 3.3% | 3.3% | 1.0 |
| Lowest since the spin | Apr 30, 2025 | 2.19M | 1.4% | 1.3% | 2.5 |
| Three months earlier | Jul 15, 2026 | 7.92M | 5.2% | 4.8% | 6.1 |
| At the valuation | Sep 30, 2026 | 8.38M | 5.5% | 5.0% | 3.3 |
| Latest | Oct 30, 2026 | 10.69M | 7.0% | 6.4% | 3.9 |
The latest share of float is higher than 39 of the 41 earlier reports since the spin. Short interest in shares, with its share of the float and of shares outstanding. FINRA settlement dates; figures are published about eight business days later. Days to cover is short interest divided by average daily volume, as reported by FINRA. Float and shares outstanding on or before each date, from this site's daily share records and the company's filings.
Short interest is the highest since the spin, at 5.5% of the float on September 30, 2026, against 1.4% at its low in April 2025, and higher than at any of the 39 earlier reports. Days to cover fell from 8.2 at the end of August 2026 to 3.3, because trading volume rose sharply in late September 2026, while the number of shares short kept rising. The short seller’s report came out on October 2, 2026, after that settlement date, so the October 15, 2026 figure, published in late October 2026, will be the first to show the positioning after it. At 5.5% of the float and three days to cover, short interest is moderate, below the levels usually associated with a squeeze, and it is consistent with the 25% weight on the worst case.
| Volatility, annualized | Last 20 sessions | Last 60 sessions | Since the spin |
|---|---|---|---|
| To November 13, 2026 | 46% | 43% | 34% |
At the last 60 sessions' volatility, one standard deviation over a month is about ±13%, or $22.86 to $29.28 from the $25.87 close; about two months in three end inside that range if volatility holds. The median daily move since the spin is 1.2%.
| Results day | Released | Close before | Close after | Move | Times a median day |
|---|---|---|---|---|---|
| May 14, 2025 | On the day | $26.64 | $27.81 | +4.4% | 3.8× |
| July 31, 2025 | On the day | $30.54 | $29.99 | -1.8% | 1.5× |
| October 23, 2025 | On the day | $33.03 | $32.80 | -0.7% | 0.6× |
| February 26, 2026 | On the day | $31.00 | $31.11 | +0.4% | 0.3× |
| May 6, 2026 | On the day | $30.09 | $28.19 | -6.3% | 5.4× |
| August 4, 2026 | On the day | $28.65 | $29.42 | +2.7% | 2.3× |
| October 27, 2026 | On the day | $23.91 | $24.31 | +1.7% | 1.4× |
Average move on a results day: 2.6% either way, against a median day's 1.2%. The move is measured from the close before the release to the close of the first session after it.
Results days have moved Millrose modestly, by 2.7% on average and 6.3% at most (May 2026), against a median day’s 1.1%. The past month is different: volatility over the last 20 sessions is 43% a year against 33% over 60 sessions, after the short seller’s report, the downgrade and a fall of 8.5% on October 5, 2026, the day the shares went ex-dividend by $0.79. The October 27, 2026 results are likely to move the stock more than earlier releases, because they answer a question about the business model and not only about the quarter. A satisfactory account of the rental program could lift the price toward the base case, $26.44; an unsatisfactory one would make the worst case the reference point, $16.61, and the asset floor of about $17 in the analysis below the level that matters.
What it means for the rating
HOLD, on watch, target $26 → $25. The target is the best-guess value, $25.40, which differs from the $26.34 of October 11, 2026 only through the weights. The action table below stands with one change: no new position before the October 27, 2026 results, whatever the price, including below $17. After the results, the stock comes off watch if the rental program is disclosed, approved by the independent directors and capped, and the weights are reset on what the results show. If the results show purchases above market or a program without a limit, the thesis no longer holds and the rating moves to SELL.
Post-Spin Analysis — October 11, 2026
Written against the October 9, 2026 close of $22.36. Primary sources: Millrose’s 2025 annual report on Form 10-K, its 10-Qs for the first and second quarters of 2026, the second-quarter 2026 results, the agreements filed at the spin (the management agreement, the Master Program Agreement and Master Option Agreement with Lennar), the September 1, 2026 amendments, the October 6, 2026 notes filing, the 2026 proxy statement, directors’ Forms 4, Schedules 13D and 13G, the SEC’s Form 13F data sets, funds’ Forms N-PORT, FINRA short-interest data, and closing prices for the stock and its peers. This is the first full analysis of Millrose on this site; the monthly reports have carried it since March 2026.
The one-line version
Millrose is a lender secured on land, priced like a leveraged mortgage REIT. It owns 143,771 homesites that Lennar and 18 other builders hold options to buy, and earns 9.2% a year on $8.8 billion of capital, with no option ever terminated. At $22.36 the shares trade at 0.63 times book value and yield 14.1%, the same discount as lending REITs that borrow four to eight times as much. Two things justify part of that discount. Growth has stopped: Millrose pays out all its earnings, will not issue shares below book and reached its debt limit with the September 2026 notes, so capital cannot grow until the price recovers. And in August 2026 it began buying finished Lennar homes to rent, without announcing it, at yields reported to be below its cost of debt; a short seller’s report on October 2, 2026, a downgrade and a lawsuit followed. Built line by line, the shares are worth $26.44 in the base case, $35.86 in the best and $16.61 in the worst; weighted, $26.34, 18% above the price. The third-quarter results on October 27, 2026 are the first chance for the company to explain the rental purchases.
Rating: HOLD (from BUY) · Target $26 · Grade B (2.70)
What the business actually is
A homebuilder that wants to own as little land as possible sells it to Millrose, and buys it back a lot at a time as it builds. Millrose buys raw or partly developed land (sometimes from the builder, at the builder’s book value), funds the development to a fixed budget, and gives the builder an option to buy the finished homesites on a schedule. Until it does, the builder pays a monthly option fee on the capital Millrose has put in. The builder also pays a non-refundable deposit, carries any cost overruns and guarantees completion. If a builder stops buying, it forfeits its deposit and pays a termination fee, and Millrose can sell the land to someone else.
| June 30, 2026 | Lennar | Other builders | Total |
|---|---|---|---|
| Invested capital | $5.95B | $2.85B | $8.80B |
| Yield on that capital | 8.5% | 10.6% | 9.2% |
| Homesites | 110,729 | 33,042 | 143,771 |
| Builders’ deposits netted against the capital | $206M | $400M | $606M |
| Deposits as a share of the land | about 3% | about 12% | |
| Remaining life of the options | 3.7 years | 2.3 years | 3.3 years |
Source: the second-quarter 2026 results and 10-Q; deposit shares are estimates from the netted balances. There are 73 pools across 877 communities in 30 states; about 51% of the capital is in California, Florida and Texas.
The capital turns over. In the first half of 2026 builders bought back homesites worth $1.78 billion and Millrose put $2.11 billion into new land. Each dollar Lennar returns is re-lent at the rate for new Lennar money, so the 8.5% on the original Lennar assets is being replaced over time.
How the yields are set. The 8.5% on the land contributed at the spin is fixed. New Lennar capital is priced each month at the three-year BBB corporate bond yield plus 4.00%, adjusted for Lennar’s credit rating (it rises one point if Lennar falls to BB), with a floor of 7% and a cap of 10%. New money for Lennar therefore earns more when interest rates rise, an estimated 9–10% at today’s bond yields. Part of the other builders’ business floats on SOFR, the short-term benchmark rate; the company has not said how much.
Revenue is almost all option fees: $195 million in the second quarter of 2026, of which Lennar paid 72%, down from more than 99% in the first quarter of 2025.
How the money moves
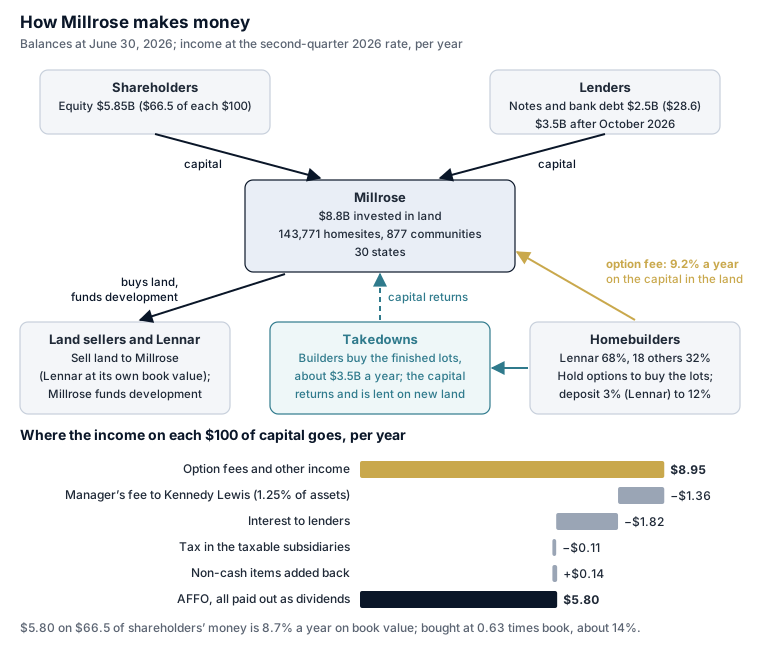
Each $100 of capital earns about $8.95 a year and pays about $5.80 to shareholders. Of the income, about $1.36 goes to the manager and $1.82 to lenders. The $5.80 is earned on the $66.50 of each $100 that shareholders put in, 8.7% a year on book value, and a buyer at today’s 0.63 times book receives about 14%. The capital turns over quickly: builders buy back about $3.5 billion of lots a year, which Millrose lends again on new land. That turnover is also what would let it pay down debt in a downturn (below).
Where the land is
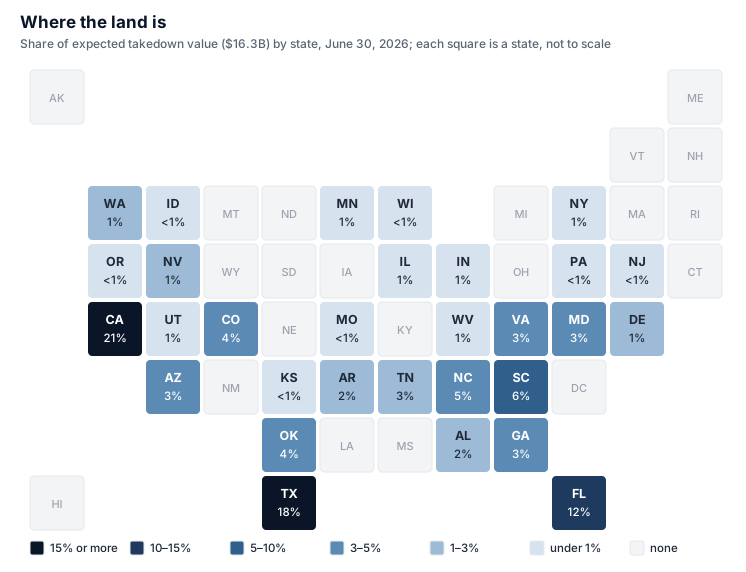
Half the value is in three states: California (21%), Texas (18%) and Florida (12%), with the Carolinas next. Texas has the most homesites (39,337) and California the most value, because its land costs more per lot. The company’s own guidelines cap any state at 40% of the portfolio. The table counts the expected total takedown value, the land plus the development still to be spent, $16.3 billion against the $8.8 billion invested so far.
| State | Communities | Homesites | Expected takedown value | Share |
|---|---|---|---|---|
| California | 66 | 12,787 | $3.38B | 20.8% |
| Texas | 191 | 39,337 | $2.99B | 18.4% |
| Florida | 123 | 20,902 | $2.00B | 12.3% |
| South Carolina | 33 | 9,214 | $0.96B | 5.9% |
| North Carolina | 43 | 5,453 | $0.80B | 5.0% |
| Oklahoma | 56 | 9,891 | $0.66B | 4.0% |
| Colorado | 24 | 3,791 | $0.59B | 3.6% |
| Georgia | 58 | 5,693 | $0.57B | 3.5% |
| Maryland | 6 | 4,450 | $0.55B | 3.4% |
| Arizona | 36 | 4,393 | $0.53B | 3.3% |
| Virginia | 16 | 3,461 | $0.51B | 3.2% |
| Tennessee | 31 | 3,208 | $0.46B | 2.8% |
| Arkansas | 38 | 4,467 | $0.32B | 2.0% |
| Alabama | 39 | 4,513 | $0.30B | 1.9% |
| Washington | 11 | 1,306 | $0.24B | 1.5% |
| Nevada | 12 | 1,352 | $0.24B | 1.5% |
| Delaware | 9 | 990 | $0.17B | 1.0% |
| Minnesota | 28 | 1,335 | $0.15B | 0.9% |
| Utah | 3 | 1,172 | $0.14B | 0.9% |
| West Virginia | 7 | 1,194 | $0.11B | 0.7% |
| Indiana | 9 | 933 | $99M | 0.6% |
| New York | 1 | 398 | $84M | 0.5% |
| Illinois | 9 | 784 | $82M | 0.5% |
| Kansas | 6 | 819 | $69M | 0.4% |
| Oregon | 8 | 503 | $58M | 0.4% |
| Pennsylvania | 2 | 334 | $52M | 0.3% |
| Idaho | 6 | 356 | $51M | 0.3% |
| New Jersey | 2 | 295 | $49M | 0.3% |
| Missouri | 3 | 440 | $34M | 0.2% |
| Wisconsin | 1 | 0 | $1M | 0.0% |
| Total, 30 states | 877 | 143,771 | $16.26B | 100% |
Source: the second-quarter 2026 10-Q, property table; excludes development loans. Wisconsin’s one community has no homesites yet.
Management Team
Millrose has no employees. It is run by an outside manager, Kennedy Lewis Land and Residential Advisors, an affiliate of Kennedy Lewis Investment Management, and its officers are Kennedy Lewis people.
| Name | Role | Background |
|---|---|---|
| Darren Richman | Chief executive and president | Co-founder of Kennedy Lewis; previously Blackstone’s credit business (GSO) |
| Garett Rosenblum | Chief financial officer | Previously chief accounting officer of Safehold and iStar, and of Arbor Realty |
| Robert Nitkin | Chief operating officer | Kennedy Lewis partner; previously Goldman Sachs |
| Rachel Presa | General counsel | Previously Kennedy Lewis’s chief compliance officer; Akin Gump |
| Adil Pasha | Chief technology officer |
The board
Carlos Migoya (chair; chief executive of Jackson Health System, former Miami city manager and Wells Fargo regional president), Patrick Bartels (Redan Advisors; formerly Monarch Alternative Capital), Matthew Gorson (senior chairman of Greenberg Traurig), Kathleen Lynch (former chief operating officer of UBS Wealth Management Americas) and M. Alison Mincey (University of Miami Health). All five are independent of Lennar.
The manager’s terms
| Term | What it says |
|---|---|
| Fee | 1.25% a year of tangible assets (gross assets, not equity), paid quarterly in advance; no incentive fee |
| Paid so far | $12.1M in the first quarter of 2025, rising to $29.9M in the second quarter of 2026, about $120M a year and 15% of revenue |
| Term | To February 7, 2028, then renewing each year |
| Ending it without cause | Two-thirds of independent directors, 180 days’ notice and a fee of three times the average annual fee (two and a half or one and a half times if the return on equity has averaged under 7%), an estimated $0.3 billion or more |
| Allocation of deals | Deals Lennar directs to Millrose go to Millrose; other land-banking deals rotate between Millrose and Kennedy Lewis’s own funds |
| Other | The credit facility defaults if Kennedy Lewis stops managing without an acceptable replacement within 90 days |
A fee on assets rewards size. The manager earns more when the balance sheet grows, whether or not growth adds to earnings per share, and the August 2026 amendment added rental-property operating costs to the expenses Millrose reimburses to it.
Control sits with Lennar’s chairman. Stuart Miller owns 98.7% of the Class B shares, which carry ten votes each, giving him 43.2% of the votes with about 7.5% of the economic interest. Lennar also holds founder’s rights until its own assets fall below 10% of Millrose’s total: priority on Millrose’s capital up to $10 billion, a consent right over any replacement manager, a cap on debt of one times equity and consent over pledges of collateral.
The insiders have bought and none has sold. Officers and directors have bought about 576,000 shares for about $14.5 million in the open market since the spin, none under a trading plan, most recently on August 7 and 10, 2026 at $28.80–29.18. The chief executive bought 265,000 shares in February 2025 at about $22–23 and 235,000 on May 11, 2026 at $27.31. Stuart Miller bought 424,630 Class A shares at $21.98–24.20 in February 2025.
The financial record — six quarters since the spin
| $ millions | Q1 2025* | Q2 2025 | Q3 2025 | Q4 2025 | Q1 2026 | Q2 2026 |
|---|---|---|---|---|---|---|
| Option fees | 80 | 141 | 170 | 179 | 185 | 195 |
| Development-loan income | 3 | 8 | 9 | 10 | 10 | 1 |
| Management fee | (12) | (22) | (26) | (28) | (28) | (30) |
| Interest | (3) | (10) | (44)† | (35) | (39) | (40) |
| AFFO (adjusted funds from operations) | 65 | 115 | 122 | 126 | 126 | 128 |
| AFFO per share | $0.39 | $0.69 | $0.74 | $0.76 | $0.76 | $0.77 |
| Dividend per share | $0.38 | $0.69 | $0.73 | $0.75 | $0.76 | $0.77 |
| Invested capital (end, $B) | 6.71 | 7.41 | 8.15 | 8.47 | 8.71 | 8.80 |
| Book value per share | $35.40 | $35.39 | $35.29 | $35.28 | $35.26 | $35.24 |
| Debt to capitalization | ~5% | ~15% | ~25% | 26% | ~29% | ~30% |
*From February 7, 2025. †Includes $16.4 million of costs written off when a term loan was repaid early. Source: quarterly results and 10-Qs. AFFO is funds from operations with non-cash items added back (financing-cost amortization, directors' stock awards and credit-loss provisions); it is the measure Millrose pays its dividend from. The dividend was raised to $0.79 on September 23, 2026, paid October 15, 2026.
The growth has come from borrowing. AFFO per share rose from $0.69 to $0.77 a quarter in a year while book value per share stayed at $35.2–35.4 and the share count did not change. All of the increase in capital, from $6.4 billion at the spin to $8.8 billion, was funded by debt, which rose from almost nothing to $2.5 billion by June 2026 and to an estimated $3.5 billion after the October 2026 notes.
The development-loan income has gone. A $284 million development loan was repaid on April 1, 2026, taking that line from about $10 million a quarter to $1 million.
REIT status, the payout, and why growth has stopped
A REIT avoids corporate tax by paying out at least 90% of its taxable income, and Millrose’s policy is to pay out 100% of AFFO. Its land is held in taxable subsidiaries (which paid an effective tax rate of about 25%, or $20.5 million in 2025), and the REIT’s own income is largely interest on loans to those subsidiaries. The 2025 dividends were taxed as ordinary income.
A REIT that pays out everything can grow only with new money, and Millrose has closed both doors for now:
- Equity. The company said in February 2026 that it will not issue shares below book value. At 0.63 times book, it cannot.
- Debt. Its target is debt of at most 33% of capitalization. After the $1.0 billion of notes and a $500 million term-loan draw in October 2026, gross debt is an estimated 37.6% of capitalization, with about $0.6 billion of cash still to deploy (both estimates).
So invested capital will stop at about $9.5 billion once the cash is lent. From there, earnings per share grow only if the yield rises: as old 8.5% Lennar capital is re-lent at the higher rate for new money, or as other builders pay more. The price is the constraint: back above book value, Millrose could issue shares and grow again.
The October 2026 notes carry a condition. If Dream Finders Homes has not completed its purchase of Beazer Homes by May 13, 2027, Millrose must redeem the $500 million of 6.75% notes due 2031, which were raised partly to buy homesites from the combined company.
How much Millrose depends on Lennar
| Share | |
|---|---|
| Invested capital, June 30, 2026 | 68% |
| Option fees, second quarter 2026 | 72% |
| Remaining development commitments | 74% of $6.9 billion |
| Votes (through Stuart Miller) | 43.2% |
Lennar has no obligation to bring Millrose more business. It “may from time to time present” land to Millrose, but Millrose must fund qualifying Lennar land up to the capital reserved for Lennar. Lennar can also re-price future land down to the lowest rate Millrose gives any other builder.
Lennar’s protections and Millrose’s are both written into the contract:
| Clause | Effect |
|---|---|
| Lennar Corporation guarantee | The parent company guarantees its subsidiaries’ payments and construction |
| Pools | Homesites are grouped into 73 pools; walking away from one property lets Millrose terminate the builder’s options on the rest of the pool and collect termination fees |
| Cap on Lennar’s exposure | Lennar’s payments on a pool it abandons are capped at $50 million for the original pools and $25 million for later ones |
| Pauses | If home prices in an area fall 10% or more, Lennar may pause its takedowns twice, for up to six months each, paying half the option fee meanwhile |
| Bulk purchase | Lennar may buy out one property, but not more than half a pool without buying the whole pool |
Lennar is weaker than it was at the spin. In the quarter to August 31, 2026 it delivered 20,840 homes (3% fewer than a year earlier), its orders fell 9% and missed its own range, its gross margin was 15.8% with incentives of about 12% of the price, and it cut its 2026 delivery target to 80,000–81,000. 86% of the homes it delivered came from land-banked land, and it owns only about 2% of the 476,000 homesites it controls. Millrose’s 110,729 Lennar homesites are an estimated 23% of that pipeline; Lennar’s other land bankers are not disclosed. Lennar trades at 0.85 times its own book value.
Credit and collateral: what a housing downturn would cost
No builder has walked away from a Millrose option, and no builder has been tested by a downturn since the spin.
What happens to the land if builders walk away
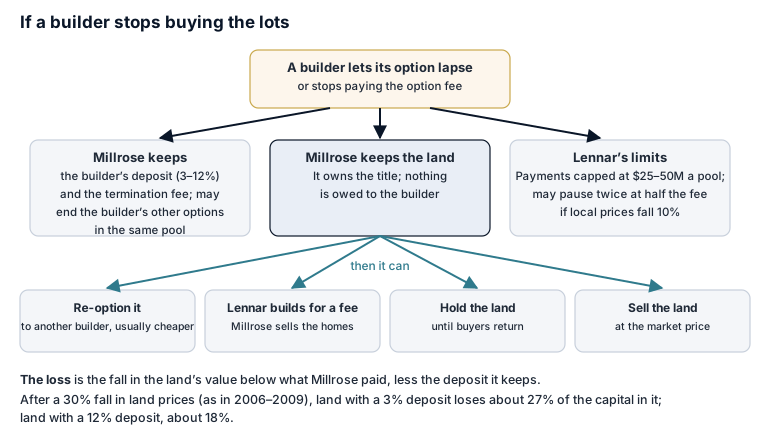
Millrose owns the land outright, so a builder walking away leaves it with the land and the deposit. The builder forfeits its deposit (about 3% of the land for Lennar, 12% for the others) and pays a termination fee, and walking away from one property lets Millrose end the builder’s options on the rest of that pool. Lennar’s total payments on an abandoned pool are capped at $50 million for the original pools and $25 million for later ones, and if local home prices fall 10% or more Lennar may first pause twice, for up to six months each, paying half the option fee.
Millrose then has four choices. It can option the land to another builder, usually on worse terms; for Lennar land, it can require Lennar, if Lennar still builds in that market, to build and sell homes on the lots for a fee, on terms to be agreed, with Millrose owning the homes; it can hold the land until buyers return; or it can sell it. The loss is the fall in the land’s value below what Millrose paid, less the deposit, and it reduces book value.
The last cycle shows the scale:
- Lennar wrote off $530 million of option deposits and pre-acquisition costs on 36,900 homesites in its 2007 fiscal year, and $152 million in 2006 and $97 million in 2008, as it walked away from land it had optioned.
- Residential land prices fell about 30% from late 2006 to mid-2009 (the Davis-Heathcote index published by the Lincoln Institute).
- Land-bank deals were “extended, modified, repriced, or resold — often at losses” (HousingWire, June 2025), and Lennar’s LandSource joint venture went bankrupt in 2008.
Some stress is visible now. NVR, which buys almost all its lots under options, impaired $30.6 million of deposits in the first half of 2026, up from $21.3 million a year earlier. D.R. Horton’s land-option charges were $65.2 million in the nine months to June 2026.
The worst case below sizes a 2007-type year at $900 million of losses (an estimate, about $5.40 a share or 15% of book value): other builders walking away from part of their options, Lennar pausing 40% of its capital at half rate for a year, and land falling far enough that deposits do not cover the gap.
What happens to the debt
All of Millrose’s debt is unsecured: no lender has a claim on particular land, apart from $33 million of mortgages on two properties that the builder services. The notes and the bank facility rank equally. The notes carry almost no financial tests; their indentures restrict liens, sale-and-leasebacks and mergers, and require an offer to repurchase at 101% on a change of control. The tests are in the bank agreement, checked every quarter:
| Bank covenant | Limit | Now (estimate, after the October 2026 notes) | Room |
|---|---|---|---|
| Net debt / (net debt + tangible net worth) | 45% at most (50% for up to five quarters after a large acquisition, twice) | about 33% | Breached only with losses well beyond the tangible-net-worth test below |
| EBITDA / interest, last four quarters | 1.5× at least | about 3.0× ($668 million / $226 million) | EBITDA could fall by half |
| Tangible net worth | $4.39 billion at least | $5.85 billion | $1.46 billion of write-downs, about $8.80 a share or 17% of the capital |
| Borrowing base: all senior debt, notes included, against 75% of the book value of lots under option (70% for lots not under contract or whose takedowns have been extended, 65% after 18 months, 50% for land held for future development) | Debt at most the base | Debt $3.5 billion against an estimated base of $6–7 billion | About $3 billion |
Covenant terms from the March 25, 2026 credit agreement; the current levels are estimates from the June 30, 2026 balance sheet and the October 2026 debt.
The tangible-net-worth test binds first. The worst case’s $900 million of write-downs uses about 60% of the room; a loss above about $1.46 billion would breach it, after which the banks could stop lending and demand the $500 million term loan and any revolver balance back. The borrowing base tightens as builders extend their takedown schedules, because extended lots move from the 75% to the 70% rate. Dividends above the REIT minimum are allowed only while Millrose is in compliance, so a breach would cut the dividend to the 90% of taxable income a REIT must pay.
How it would repay its debt in a severe downturn
The portfolio pays itself down. Every lot a builder buys returns capital, and in a downturn Millrose can stop lending it out again and use it to repay debt. An illustration, with takedowns falling to 40% of their recent pace for two years and 60% in the third (all estimates):
| $ billions | 2027 | 2028 | 2029 | Total |
|---|---|---|---|---|
| Takedown proceeds (recent pace about $3.5 a year) | 1.4 | 1.4 | 2.1 | 4.9 |
| Cash on hand after the October 2026 notes | 0.6 | 0.6 | ||
| Available to repay debt | 5.5 | |||
| Debt outstanding after October 2026 | 3.5 | |||
| Debt due before 2030 | 0.5 (only if Dream Finders–Beazer fails) | 0.5 | 1.0 |
Option fees, even with Lennar paying half on paused land, would still cover the interest of about $0.23 billion a year, and the dividend would fall with earnings. On these figures Millrose could repay all its debt by 2029 from takedowns alone, without selling land.
When it would have to sell land below cost
Only if builders stopped buying almost entirely and the bond market were closed when the 2029–2030 maturities came due. No debt is due before October 2029 except the possible early repayment of the 2031 notes in 2027, and $1.75 billion falls due in 2030. The risk that would force sales sooner is the tangible-net-worth covenant: write-downs above about $1.46 billion would let the banks withdraw the revolver and the term loan. Selling land into a falling market would itself crystallize losses and use up that room, which is why a land lender’s real defense is low debt and slow, steady takedowns. In its 2007 fiscal year Lennar wrote off its deposits on 36,900 optioned homesites; a repeat on Millrose’s book would test the covenant, though not the ability to pay the notes.
The finished-homes purchases
What the filings show. On August 27, 2026 Millrose and Lennar amended two agreements, filed on September 1, 2026:
- The management agreement’s investment guidelines now allow “single family homes to be held and operated as rental properties pursuant to an approved single family home rental strategy”, and rental operating costs became reimbursable to the manager.
- The founder’s agreement with Lennar defines “BTR Properties” (build-to-rent), completed homes “intended to be operated… as rental properties”, excludes capital raised only for them from Lennar’s capital priority, and lets Millrose pledge them separately.
- The 2025 10-K had said Millrose did “not currently intend to diversify our business operations beyond growing our homesite option platform and… development loans.”
Neither the second-quarter results of August 4, 2026 nor any later release mentions buying or renting homes.
What the short seller alleges. Hunterbrook Media’s report of October 2, 2026, published while Hunterbrook Capital was short both Millrose and Lennar, says from county deed records that Millrose bought more than 700 finished Lennar homes in 15 states for about $200 million in roughly a month, 356 of them in the last week of Lennar’s fiscal quarter, when Lennar beat the bottom of its delivery guidance by 340 homes. A second report on October 8, 2026 counts about 1,096 purchases worth about $290 million, nearly all listed for ordinary rent by the property manager Evergreen Residential, and estimates a net rental yield of about 5.9%. It also reports that management had described the program to Goldman Sachs as a rent-to-own pilot, which the property manager’s staff did not recognize. Its price comparison (Millrose paying 13% more than individual buyers) depends on deducting Lennar’s average incentive from the buyers’ prices, and the unadjusted averages were almost identical ($290,661 against $291,112).
What is not known. Neither company has responded, and Millrose has filed nothing since. The size the program is meant to reach, its approval by the independent directors, the price-setting process and the financing are all undisclosed. At the reported net yield of about 6%, rental homes earn less than the 6.5–6.75% Millrose just paid on its notes and much less than the 9–10% it earns on land, so each dollar moved into rentals lowers earnings per share: the base case below carries $0.6 billion at 6% and the worst case $1.0 billion at 5%.
What followed. Citizens (JMP) downgraded the shares to Market Perform on October 5, 2026, citing the shift in the business and “a potential conflict of interest”; that day the stock fell 8.5%, of which about 3.2 points was the $0.79 dividend going ex. Several law firms announced investigations, and a securities class action was reported filed in the Southern District of Florida on October 9, 2026 for buyers between February 7, 2025 and October 2, 2026 (from law-firm notices and a court docket listing; not confirmed here from the court’s own records).
Capital allocation
| Since the spin | Amount |
|---|---|
| Dividends declared | $4.87 a share including the $0.79 paid October 15, 2026, about $0.8 billion |
| Senior notes issued | $1.25B 6.375% 2030 (August 2025), $0.75B 6.25% 2032 (September 2025), $0.5B 6.50% 2029 and $0.5B 6.75% 2031 (October 2026) |
| Revolving credit and term loan | $1.385B revolver (SOFR plus 2.00–2.50%, cut by 0.25 point in August 2026), $0.5B term loan drawn in October 2026; maturing March 2030 |
| Shares issued | None, apart from directors’ stock awards |
| Shares repurchased | None |
Every dollar of earnings has been paid out, and every dollar of growth borrowed. That is a reasonable structure for a REIT with a 9.2% yield and debt at 6.4%, and it has lifted AFFO per share by 12% in a year. It leaves the company with no retained cash when debt is at its limit and the shares are below book, which is where it now is.
The debt, tranche by tranche
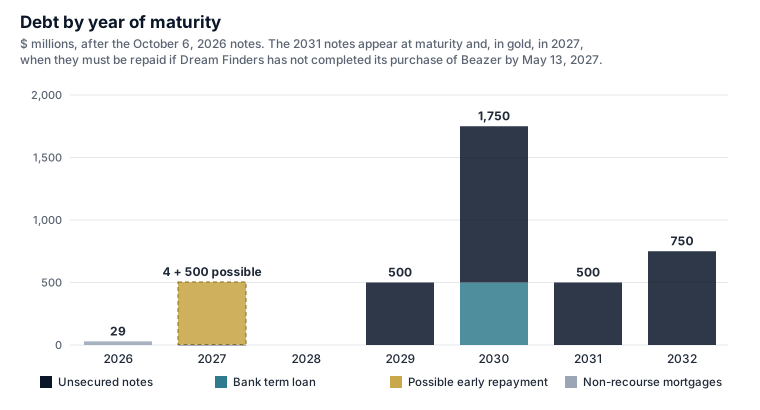
| Tranche | Amount | Rate | Matures | Callable | Notes |
|---|---|---|---|---|---|
| Purchase-money mortgages | $33M | $29M in 2026, $4M in 2027 | Non-recourse; secured on two properties; the builder pays the interest | ||
| 6.50% senior notes | $500M | 6.50% | October 15, 2029 | From October 15, 2027 | Issued October 6, 2026 at par |
| Bank term loan | $500M | SOFR + 2.00–2.50% | March 25, 2030 | Prepayable | Drawn in October 2026 |
| Revolving credit | $1.385B available | SOFR + 2.00–2.50% | March 25, 2030 | $850M drawn on September 21, 2026, to be repaid from the October 2026 notes; balance since not disclosed | |
| 6.375% senior notes | $1,250M | 6.375% | August 1, 2030 | From August 1, 2027 | Issued August 7, 2025 |
| 6.75% senior notes | $500M | 6.75% | October 15, 2031 | From October 15, 2028 | Must be redeemed if Dream Finders has not completed its purchase of Beazer by May 13, 2027 |
| 6.25% senior notes | $750M | 6.25% | September 15, 2032 | From September 15, 2028 | Issued September 2025 |
| Total | about $3.5 billion | about 6.4% blended | All unsecured except the mortgages; guaranteed by two Millrose subsidiaries |
Sources: the second-quarter 2026 10-Q (Note 8) and the October 6, 2026 8-K. The bank margin is 2.00% at leverage up to 30%, 2.25% up to 40% and 2.50% above; it was cut by 0.25 point in August 2026.
Nothing large falls due before October 2029, and the $1.75 billion due in 2030 is the refinancing to watch. The notes can be repaid early at set premiums from 2027–2028, which would let Millrose retire them from takedown proceeds if it stopped growing.
Valuation
Three scenarios
| Driver | Best | Base | Worst |
|---|---|---|---|
| Invested capital | Grows 4–6% a year from 2027, funded with shares issued above book once the price recovers | Flat at about $9.5 billion once the October 2026 cash is lent | Shrinks to $8.4 billion as builders walk away and debt is repaid |
| Yield on new Lennar money | 9.5% | 9.2% | 8.8% |
| Other builders’ yield | 10.5–10.6% | 10.0–10.4% (SOFR falls) | 9.7–10.0% |
| Rental homes | $0.3 billion at 6.5% net | $0.6 billion at about 6% net | $1.0 billion at 5% net |
| Housing downturn | None | None | Lennar pauses 40% of its capital at half rate for a year; $900 million of losses on abandoned land |
| Cost of debt | 6.3% | 6.45% | 6.7% |
| Cost of equity / long-run growth | 11% / 1.5% | 12.5% / 0.5% | 14.5% / 0% |
| 2025 | 2027E | 2028E | 2029E | 2030E | |
|---|---|---|---|---|---|
| Base: AFFO per share | $2.58* | $3.15 | $3.09 | $3.11 | $3.12 |
| Best | $3.33 | $3.39 | $3.45 | $3.48 | |
| Worst | $2.10 | $2.31 | $2.32 | $2.33 | |
| Base: book value per share | $35.28 | $35.24 | $35.24 | $35.24 | $35.24 |
| Worst: book value per share | $32.53 | $29.82 | $29.82 | $29.82 |
*Eleven months. The model reproduces the second quarter of 2026 at $0.769 a share against $0.77 reported. Dividends are 100% of AFFO, so the worst case cuts the dividend by about a third in 2027.
The value, by scenario
Value is the dividends discounted at the cost of equity: the $0.79 declared for the fourth quarter of 2026, four forecast years, and a terminal value on the 2030 dividend.
| Scenario | Per share | vs $22.36 | Price to book at that value | Weight |
|---|---|---|---|---|
| Best | $35.86 | +60% | 1.01× | 25% |
| Base | $26.44 | +18% | 0.75× | 50% |
| Worst | $16.61 | −26% | 0.56× | 25% |
| Probability-weighted | $26.34 | +18% |
The 25 / 50 / 25 weights are a judgement. Other weightings give $23.45–27.30:
| Best / base / worst | Value |
|---|---|
| 30 / 50 / 20 | $27.30 |
| 25 / 50 / 25 (the target) | $26.34 |
| 20 / 60 / 20 | $26.36 |
| 20 / 50 / 30 | $25.37 |
| 10 / 50 / 40 | $23.45 |
What the best case needs: interest rates easing and the rental program kept small and disclosed, so the shares return to book value and Millrose can issue equity and grow again. What the worst case needs: a housing downturn deep enough for Lennar to pause and other builders to walk away, at the same time as the rental book grows to $1 billion.
What the price implies
$22.36 discounts the base-case dividends at 14.8%, close to the 14.1% dividend yield and in line with lending REITs that carry far more debt. The expected gain is 3.8 times the expected loss on the weighted scenarios, and $24.39 is the price at which that ratio falls to two to one. The stricter test points the other way: the base case is $4.08 above the price and the worst case $5.75 below it, a ratio of 0.71.
What moves the value
| Change to the base case | Value | Change |
|---|---|---|
| Cost of equity 11% (not 12.5%) | $30.10 | +$3.66 |
| Cost of equity 14% | $23.59 | −$2.85 |
| Cost of equity 15%, the lending REITs’ level | $22.02 | −$4.42 |
| Rental homes $1.5 billion (not $0.6 billion) | $24.82 | −$1.62 |
| New Lennar money at 8.5% (not 9.2%) | $24.90 | −$1.54 |
| Other builders’ yield 1 point lower (SOFR) | $24.99 | −$1.45 |
| New Lennar money at 9.8% | $27.75 | +$1.32 |
| Debt costs 0.5 point higher | $25.63 | −$0.80 |
Base case, per share, by cost of equity and long-run dividend growth:
| Cost of equity ↓ / growth → | 0% | 0.5% | 1.0% | 1.5% |
|---|---|---|---|---|
| 10% | 31.95 | 33.18 | 34.55 | 36.08 |
| 11% | 29.11 | 30.10 | 31.18 | 32.38 |
| 12% | 26.75 | 27.55 | 28.43 | 29.39 |
| 12.5% | 25.71 | 26.44 | 27.23 | 28.10 |
| 13% | 24.75 | 25.41 | 26.13 | 26.92 |
| 14% | 23.03 | 23.59 | 24.19 | 24.84 |
The cost of equity matters more than any operating input: each point is worth about $2.50–3.50 a share. That is the market’s price for risk in yield stocks, and it moved with the 10-year Treasury yield in September 2026 (below).
Book value and earnings
| Measure | At $22.36 |
|---|---|
| Price to book (June 30, 2026) | 0.63× |
| Price to 2025 AFFO | 8.7× |
| Price to the base case’s 2027 AFFO | 7.1× |
| Dividend yield on $3.16 | 14.1% |
| Market value, all 166.05 million shares | $3.71 billion |
Book value is close to invested capital, because Millrose carries its land at cost and has no goodwill. At 0.63 times book, the price implies the market expects either losses on about a third of the land or a permanently higher cost of equity.
What this most resembles
Real-estate companies separated from the business that occupies or uses their property, measured from each company’s first-day price. None of these has a full profile on this site yet.
| Spinoff | Parent and main counterparty | First day | First year | Two years | Since the spin, a year | Outcome |
|---|---|---|---|---|---|---|
| Four Corners Property Trust | Darden (Olive Garden, LongHorn restaurants) | Nov 2015 | +34.4% | +77.2% | +7.1% | Diversified away from Darden |
| CareTrust REIT | Ensign Group (nursing homes) | Jun 2014 | +22.1% | +26.1% | +9.0% | Diversified; the tenant stayed healthy |
| Gaming and Leisure Properties | Penn National (casinos) | Nov 2013 | −4.0% | −3.5% | +4.6% | Grew by buying other casinos’ property |
| Uniti | Windstream (telecom) | Apr 2015 | −6.3% | +15.9% | −4.6% | The tenant went bankrupt in 2019 |
| Quality Care Properties | HCR ManorCare, via HCP | Nov 2016 | +7.7% | The tenant went bankrupt; the company was taken over in 2018 | ||
| Curbline Properties | SITE Centers (shopping centers) | Oct 2024 | +2.5% | +30.0% | +12.0% | |
| Millrose | Lennar | Feb 2025 | +28.0% | +1.1% |
The outcome in each case followed the health of the main counterparty and the speed of diversification away from it. Four Corners and CareTrust diversified while their tenants stayed sound; Uniti and Quality Care did not diversify in time. Millrose has moved faster than any of them, to 68% from 100% in eighteen months, but its main counterparty is a homebuilder in a weakening housing market.
In depth: the land-banking market
The business is large and growing, and Millrose is the only public company in it. Industry estimates put land-banked capital at $35–40 billion (Zelman & Associates and John Burns Research and Consulting, weakly sourced), against Millrose’s $8.8 billion. Public builders owned about 26% of their lots in early 2024 and control the rest through options.
| Builder | Lots controlled through options | As of |
|---|---|---|
| Lennar | 98% of 476,000 | August 31, 2026 |
| NVR | about 100% of 184,400 | June 30, 2026 |
| D.R. Horton | 78% of about 570,000 | June 30, 2026 |
| Toll Brothers | 58% of 75,500 | July 31, 2026 |
| PulteGroup | 55% of 228,000 | June 30, 2026 |
Terms elsewhere are richer than Lennar’s. Private land bankers charge option fees of about 10–11% or more and take deposits of 10–15% of the land (HousingWire, John Burns, Acres), against Lennar’s 8.5% on the original assets and a deposit of about 3%. Millrose’s other builders pay 10.6%, near the market.
| Competitor | What it does |
|---|---|
| Värde Partners | Facilities for Taylor Morrison (over $1 billion), AMH and David Weekley |
| TPG Angelo Gordon | Essential Housing funds; deals for Lennar and Toll Brothers |
| Domain Real Estate Partners with PGIM | About $4 billion of land-banking deals since 2025 |
| Bedrock Land Finance with Guggenheim | Over $1 billion committed to 16 builders; targeting $5 billion |
| Blue Owl | $1.7 billion with FivePoint and Hearthstone (March 2026) |
| Kennedy Lewis funds | Millrose’s own manager runs competing funds and shares deal flow with them |
Millrose’s advantages are its cost of capital and its scale: unsecured notes at 6.25–6.75%, against private funds’ equity, and a single counterparty able to take $1 billion pools. Its disadvantage is Lennar’s terms. The original Lennar capital earns less than the market rate, and Lennar can re-price new capital to the best rate Millrose offers anyone else. As private land bankers multiply, the 10.6% earned from other builders is the number to watch.
In depth: valuation against peers
No other public company does what Millrose does, so two groups bracket it: REITs that lend against real estate, which share its yield and credit risk, and homebuilders, whose cycle drives its counterparties. Prices at October 9, 2026; book values at June 30, 2026 (Lennar August 31, 2026, Toll July 31, 2026); dividend yields on the latest declared rate (Yahoo Finance).
| Company | Price | Change Sep 11–Oct 9, 2026 | Price to book | Dividend yield | Debt to equity |
|---|---|---|---|---|---|
| Millrose | $22.36 | −24.7% | 0.63× | 14.1% | 0.43× (before October 2026) |
| Starwood Property Trust | $12.71 | −18.6% | 0.72× | 15.1% | 3.31× |
| Blackstone Mortgage Trust | $11.03 | −17.4% | 0.58× | 17.0% | 4.85× |
| Ladder Capital | $8.77 | −8.7% | 0.78× | 10.5% | 2.82× |
| Arbor Realty | $2.87 | −39.2% | 0.25× | 23.7% (cut 43%) | 3.87× |
| Safehold (ground leases) | $12.00 | −14.5% | 0.35× | 5.9% | 1.77× |
| Lennar | $76.69 | −3.7% | 0.85× | 2.6% | 0.28× |
| D.R. Horton | $134.88 | −2.2% | 1.59× | 1.3% | 0.29× |
| PulteGroup | $112.12 | −5.2% | 1.62× | 0.9% | 0.19× |
| Forestar (lot developer) | $25.65 | −4.5% | 0.70× | 0.44× |
Millrose trades like the lending REITs on price to book and yield, with a sixth to a tenth of their leverage. The commercial mortgage REITs carry office and construction loans, and Arbor has just cut its dividend after losses. Millrose’s assets are land with a builder’s deposit and guarantee in front of them. On leverage alone it deserves a smaller discount; on concentration, governance and the unexplained rental purchases, the discount is earned. The price-to-book method gives $26.43 at 0.75 times book, the base case’s implied multiple, and the dividend method gives the same.
Interest rates
Rates reach Millrose in three ways:
| Channel | Direction when rates rise | Size |
|---|---|---|
| Cost of equity | Down: yield stocks are re-priced against bonds | About $2.50–3.50 a share per point |
| Yield on new Lennar money (three-year BBB yield plus 4.00%, capped at 10%) | Up | +$1.32 at 9.8% |
| Other builders’ floating yields (SOFR) | Up | About $1.45 a share per point |
| Interest on floating debt (revolver and term loan at SOFR plus 2.00–2.50%) | Down | About $0.80 per half point on all debt |
| Builders’ sales and takedowns | Down | The worst case |
In September and October 2026 rates moved against it. The Federal Reserve raised its target to 3.75–4.00% on September 16, 2026, the first increase since 2023; the 10-year Treasury yield rose from 4.96% on September 11, 2026 to 5.22% on October 8, 2026 (a peak of 5.31% on October 5, 2026), its highest since 2002; and the 30-year mortgage rate rose to 7.40% (Freddie Mac, October 8, 2026), its seventh weekly increase. Fed funds futures price about three more increases in the next year (an indicative reading). Most of Millrose’s debt is fixed, and its yields on new money rise with rates, so the earnings are better protected than the valuation.
Who has been trading
Closing prices rebased to August 31 = 100. Baskets are equal-weighted. Prices exclude dividends: Millrose went ex-dividend $0.79 (about 3.2% of its price) on October 5, 2026. Source: Yahoo Finance closes.
Until October 1, 2026 Millrose fell with the lending REITs; after that it fell on its own news.
| Period, 2026 | Millrose | Lending REITs (Starwood, Blackstone Mortgage, Ladder) | Safehold | Homebuilders (Lennar, D.R. Horton, PulteGroup) | S&P 500 |
|---|---|---|---|---|---|
| September 11–22 | −3.2% | −2.3% | −4.1% | +4.1% | +1.2% |
| September 22–October 1: notes priced, Treasury yields jump | −12.3% | −11.4% | −12.3% | −3.6% | −1.2% |
| October 1–9: short report, downgrade, lawsuit | −11.3%* | −1.8% | +1.8% | −3.9% | +1.9% |
| September 11–October 9 | −24.7% | −14.9% | −14.5% | −3.7% | +1.9% |
*Including the $0.79 dividend going ex on October 5, 2026, about 3.2 points. About eight points of the fall are specific to Millrose, and they came after the short report.
Daily volume (bars) and cumulative volume as a share of the 154.2 million listed Class A shares (line); the 11.8 million Class B shares are not listed. Gold bars mark days with a notable event; hover over one to see what happened. Source: this site's daily price archive (Yahoo Finance), through Oct 9, 2026.
Who holds it. Lennar distributed one Millrose share for every two of its own on February 7, 2025 and kept about 20%. It exchanged that stake for Lennar shares in an offer completed on November 26, 2025, and holds almost none today. The largest holders on June 30, 2026, from Forms 13F:
| Holder | Shares, June 30, 2026 | Change since March 31, 2026 | % of Class A |
|---|---|---|---|
| BlackRock | 22.2M | +1.6M | 14.4% |
| Vanguard (two entities) | 22.5M | +0.7M | 14.6% |
| Fidelity (FMR) | 8.2M | +1.7M | 5.3% |
| State Street | 6.8M | +1.5M | 4.4% |
| Brave Warrior Advisors | 6.0M | −2.5M | 3.9% |
| Manulife | 4.1M | −0.2M | 2.7% |
| Permian Investment Partners | 4.0M | +0.1M | 2.6% |
| Norges Bank | 3.9M | New | 2.5% |
| Cannell & Spears | 3.7M | No change | 2.4% |
| Sixth Street Partners | 2.4M | New | 1.6% |
| AQR | 2.3M | +1.4M | 1.5% |
| Two Sigma | 1.4M | −1.6M | 0.9% |
In the second quarter of 2026 quantitative and multi-strategy funds sold (Citadel from 2.1 million shares to 55,000, Two Sigma, Los Angeles Capital, Capital World) while Norges Bank, Sixth Street, Fidelity and AQR bought. The holders who sold in October 2026 will show in the third-quarter Forms 13F, due by about November 16, 2026. Stuart Miller held 12.5 million shares, mostly Class B, at his last filing.
Short interest has risen through 2026, from about 5 million shares between January and May 2026, and 7.8 million on June 30, to 8.38 million (5.4% of the Class A shares, 3.3 days of volume) on September 30, 2026, before the short report. The October 15, 2026 figure, published about October 26, 2026, will show how much was added after it. Borrowing the shares cost about 0.3–0.4% a year in September 2026 (third-party data), which is cheap.
Which indexes hold it
| Index family | Membership | Evidence |
|---|---|---|
| S&P Dow Jones | S&P SmallCap 600 since February 10, 2025, real estate sector; S&P 600 Value and Growth | S&P’s announcement; State Street’s S&P 600 funds, October 8, 2026 |
| FTSE Russell | Russell 1000, Russell Midcap, Russell 1000 Value, Russell 2500 | Russell index funds’ filings, March 2025 to June 2026 |
| MSCI | MSCI US REIT Index (Vanguard Real Estate, 5.9 million shares); MSCI USA Small Cap, inferred | Funds’ filings |
| FTSE Nareit | All Equity REITs: classified as an equity REIT (residential), not a mortgage REIT | iShares REIT funds’ filings; Nareit’s directory |
| Other | Vanguard total-market and small-cap funds; real-estate, high-dividend and spinoff funds | Funds’ filings |
The largest index holders are iShares’ S&P SmallCap 600 fund (9.3 million shares), Vanguard Real Estate (5.9 million) and Vanguard’s total-market fund (4.9 million). No size-index move is due: at $22.36 the market value is $3.71 billion. A fall below about $16.30 on the Russell rank day of October 30, 2026 could move it to the Russell 2000, which would bring net buying, an estimate; the S&P MidCap 400 needs about $48 a share. The classification as an equity REIT matters: it keeps Millrose in the large real-estate index funds, which a reclassification as a mortgage REIT would take it out of.
In depth: is Millrose an acquisition target?
Unlikely while its structure stands. Stuart Miller controls 43.2% of the votes and the charter limits the Miller family to 12.8% of the shares; Lennar’s founder’s rights give it a veto over a replacement manager; and ending the management agreement costs about three times the annual fee. A buyer would need Lennar’s and Miller’s agreement and would inherit Lennar’s below-market terms. The likelier change is internal: the board could seek to internalize management or renegotiate the fee if the shares stay well below book, which the termination fee makes expensive but not impossible.
Tail scenarios
Upside tails
- Rates fall back and the rental program is shut or kept small and disclosed (estimated 15%): the shares return to book value, Millrose issues equity and capital grows again; about $35–38 a share, the best case.
- Management is internalized on reasonable terms (estimated 5%): the fee of about $120 million a year, $0.72 a share, becomes a smaller internal cost; worth an estimated $3–4 a share at the base cost of equity.
Downside tails
- The rental purchases prove to be supporting Lennar’s deliveries at a loss and grow beyond $1 billion (estimated 15%): earnings per share fall and the governance discount becomes permanent; about $19–21 a share.
- A housing recession with builders walking away (estimated 10%): the worst case, $16.61, with a dividend cut of about a third; deeper land-price falls than the 2007–2009 30% would take it lower.
- Lennar is downgraded to high yield: new Lennar money earns a point more under the contract, but the market would price Lennar’s credit risk into Millrose first.
The downside, in asset value and in price
There are two kinds of downside, and they give different answers: what the land would leave shareholders if the business were wound down, and what the market will pay for the shares in the meantime.
What the land would leave shareholders
Starting from the June 30, 2026 balance sheet ($9.6 billion of land, $5.85 billion of equity, $35.24 a share), assume that builders walk away and Millrose keeps their deposits; that it sells the land at a discount and pays 5% in selling costs; that it pays the manager’s termination fee (about $360 million); and that it repays all its debt and other liabilities. What is left, per share (all estimates):
| Fall in land prices | Every builder walks, Lennar included | A 2007-type year: 30% of Lennar’s land and half the other builders’ land walks | Only the other builders walk |
|---|---|---|---|
| 0% | $32.42 | ||
| 10% | $28.34 | ||
| 20% | $22.84 | ||
| 30% (the 2006–2009 national fall) | $17.35 | $27.50 | $28.79 |
| 40% | $11.85 | $25.47 | $26.89 |
| 50% | $6.36 | $23.44 | $24.99 |
| About 62% | Nothing left for shareholders |
- Today’s price equals what would be left if every builder, Lennar included, walked away from every lot and land fell about 21% (29% before selling costs and the manager’s fee).
- A 2007-type year leaves more than today’s price even with land down 50%. In its 2007 fiscal year Lennar wrote off its deposits on 36,900 optioned homesites; applied here, that is about 30% of Lennar’s land and half the other builders'.
- The lenders are covered unless land falls more than about 60% across the whole book. Shareholders take the first loss, and there is a large cushion of it in front of the debt.
No price makes the shares free of risk, but some are covered by the land under harsh assumptions:
| Price | Covered even if… |
|---|---|
| About $22 (today) | Every builder walks and land falls 21% |
| About $17 | Every builder walks and land falls 30%: the 2006–2009 fall, applied to every lot |
| About $12 | Every builder walks and land falls 40% |
| About $6 | Every builder walks and land falls 50% |
About $17 is the nearest thing to a floor. Five things make it softer than it looks:
- Book value is cost, not an appraisal. Lennar contributed its land at its own book value without independent valuation, and partly developed land can be worth less than what has been spent on it.
- A wind-down is slow. Land takes years to sell, interest and fees continue meanwhile, and forced sales in 2008 went far below these discounts: one Lehman-financed portfolio carrying more than $300 million of debt was bought at auction for $71 million (Builder Online).
- The bank covenant trips early. Write-downs of about $1.46 billion, roughly a 15% fall with every builder gone, would let the banks withdraw the revolver and term loan, although the notes are not due until 2029–2032.
- The rental homes are not land. Their size and value are not yet disclosed.
- Governance adds cost at each step: the termination fee, and decisions taken by a manager whose largest counterparty’s chairman controls 43% of the votes.
What the market could pay in the meantime
The shares can trade far below what the land would fetch: lending REITs trade at 0.25–0.78 times book today (Arbor at 0.25, Safehold at 0.35). Holding for three years in the worst case, with book value falling to $29.82 and the dividend cut to about $2.10–2.33:
| End-2029 price, worst case | Price | Dividends received | Total against $22.36 |
|---|---|---|---|
| 0.56× book, the worst case’s own multiple | $16.70 | $6.94 | +6% |
| 0.40× book, a 2008-style REIT discount | $11.93 | $6.94 | −16% |
| 0.30× book, a panic | $8.95 | $6.94 | −29% |
The marked-to-market downside is larger than the asset downside: the worst-case value is $16.61 (−26%), and a housing recession with a governance discount could take the shares to $9–12 (−45% to −60%) for a time while the land still covered more. The dividend softens it: $2.10 is still 9.4% on today’s price.
Below about $17, the land covers the price even in a 2006–2009 fall on every lot. Between $17 and today’s price, the risk is mainly governance and sentiment, not the land.
What would change this view
| Direction | Trigger |
|---|---|
| Better | A full account of the rental program on October 27, 2026: its size, approval by the independent directors, pricing and a cap; AFFO at or above $0.80 a quarter; option fees from other builders still near 10.5%; insiders buying after the report |
| Worse | Rental homes above $1 billion or funded with the land-banking balance sheet; any option termination or Lennar pause; a dividend held flat or cut; the 10-year Treasury yield above 5.5% |
| Dated | Third-quarter results, October 27, 2026; short interest for October 15, 2026, about October 26, 2026; Russell rank day, October 30, 2026; Forms 13F, about November 16, 2026; lead-plaintiff deadline in the class action, December 8, 2026; Dream Finders–Beazer completion, by May 13, 2027 |
| Thesis-breaking | Evidence that Millrose paid Lennar above market for homes to meet Lennar’s delivery targets |
Investment Scorecard
| Dimension | Weight | Score | Rationale |
|---|---|---|---|
| Financial Profile | 25% | 3.0 | A 9.2% yield on capital, AFFO per share up 12% in a year and no losses, against a 100% payout, debt above the company’s own 33% target after October 2026, and no way to grow while the shares are below book |
| Competitive Position | 25% | 3.0 | The only public land banker, with $8.8 billion and 19 builders, and a cheaper cost of debt than private funds; held at 3 by Lennar’s below-market terms and repricing right, and by competition from private capital |
| Strategic Rationale | 20% | 3.0 | The separation gave Lennar an asset-light balance sheet and Millrose a growing book with other builders; held at 3 because the agreements, by the company’s own account, were not negotiated at arm’s length |
| Management & Governance | 20% | 2.0 | An outside manager paid on assets with a termination fee of about three times its fee, 43% of the votes with Lennar’s chairman, and a move into rental homes made without announcement and still unexplained; insiders’ $14.5 million of purchases keep it from 1.5 |
| Acquisition Potential | 10% | 2.0 | Voting control, founder’s rights and the management agreement make a takeover unlikely |
| Weighted Score | 2.70 | ||
| Investment Grade | B | Moderate / Hold |
What moved and what deliberately did not. This is Millrose’s first grade on this site. Management & Governance carries the grade down: the rental purchases are charged there, as a governance and disclosure question, and not again to Financial Profile, where only their effect on earnings is scored. Lennar’s concentration is charged to Competitive Position, where its terms are scored, and not to Strategic Rationale, where only the separation’s structure is. The grade measures the business; the rating below measures the price. A B-grade business at 0.63 times book can still be worth owning, and the rating turns on whether the rental question is answered.
Notes on this site’s earlier reports
- Lennar’s stake. The March 2, 2026 report’s table said Lennar “retained ~20%”. That was true at the spin, but Lennar had exchanged the stake for its own shares in an offer completed on November 26, 2025, three months before the report. It holds almost no Millrose shares. Data correction.
- “The land-bank model has not changed.” The September 30, 2026 report said so. The amendments allowing rental homes were dated August 27, 2026 and filed on September 1, 2026, before that report. An omission: the business changed.
- The monthly reports rated Millrose BUY from March to September 2026 without a full analysis. This analysis replaces that rating with HOLD, for the reasons below.
October 2026 recommendation
Rating: HOLD (from BUY). Target: $26. Grade: B (2.70).
Why HOLD rather than BUY.
- The rental purchases are a change of business that the company has not explained. The third-quarter results on October 27, 2026, sixteen days away, are where it has to. Buying before then is a bet on an answer nobody has.
- The base case is worth 18% more than the price, but the worst case is 26% below it, and the stricter asymmetry test (0.71) does not clear one to one.
- Growth has stopped until the shares return to book value, so the return is the dividend, and the dividend depends on the questions above.
Why HOLD rather than SELL.
- The price is below $24.39, where expected gain is twice expected loss on the weighted scenarios, and implies a 14.8% cost of equity on dividends that the base case keeps flat.
- The land book is sound so far: no termination since the spin, deposits and guarantees in front of the land, and debt at a fraction of the lending REITs’ leverage.
- The land covers today’s price unless every builder walks and land falls more than about 21%, and a 2007-type year leaves more than the price even with land down 50%.
- Insiders have bought $14.5 million of stock and none has sold.
| Action | Level | Reason |
|---|---|---|
| Buy | Below about $17 | Covered by the land even if every builder walks and land falls 30%, the 2006–2009 fall on every lot; the rental question matters less at that price |
| Accumulate | Below $24.39, once the October 27, 2026 results explain the rental program and cap it | Two-to-one on the weighted scenarios; the condition is the disclosure |
| Hold | $17–30, until the results answer the rental question | Above the asset floor and below the base case at an 11% cost of equity |
| Trim | Above $30 | The base case at an 11% cost of equity |
| Move to BUY | A disclosed, capped rental program with independent approval, AFFO of $0.80 or more a quarter, and no terminations | |
| Move to SELL | Rental purchases above $1 billion, a dividend cut, or evidence of purchases above market to support Lennar’s deliveries |
What the third-quarter results (October 27, 2026) must show:
| Line | The test |
|---|---|
| Rental homes | How many, at what price and yield, approved by whom, funded how, and the size the program may reach |
| AFFO per share | At least $0.79, the dividend just declared; the company guided to an exit rate of about $0.80 |
| Lennar | Takedowns and new funding; any pause request; the rate on new Lennar capital |
| Other builders | Yield still near 10.5%; new counterparties; any deposit forfeitures |
| Leverage | Debt to capitalization and the plan to return to 33%; use of the October 2026 notes |
| Book value | At or near $35.24 a share |