Vylor Inc. VYLR
+6.1%vs Day 1Spinoff of Corteva (CTVA) · Classic Spinoff · Spun Oct 1, 2026
Expected return (11/13/2026): -27% Gain to loss: 0.0 : 1Seed pure-play (~$10.4B of 2026 sales) spun from Corteva on October 1, 2026; on plan after its first results, but the price needs the plan beaten and a takeover multiple held; a states' fraudulent-transfer suit continues
Current Stats
Post-Spinoff Performance
| Timeline | |
| Spinoff date | October 1, 2026 · NYSE |
| Days since spinoff | 44 days |
| Structure | Classic Spinoff |
| §355(e) window closes statutory; a tax matters agreement may bar more, and for longer | October 1, 2028 |
| Parent | Corteva (CTVA) |
| Day-1 reaction | |
| Day 1 open | $66.00 |
| Day 1 return (open→close) | +3.4% |
| Day 1 price (close) | $68.26 |
| Day 1 range | $65.00 – $75.00 +15.4% spread |
| Day 1 low held? | Never breached day 1 was the bottom |
| Price levels | |
| Post-spin low (closing) | $67.26 on Oct 2, 2026 · 1 days post-spin |
| Lowest traded | $65.00 on Oct 1, 2026 · day 1 |
| Current price (Nov 13, 2026) | $72.54 |
| Returns | |
| Return vs Day 1 (close) | +6.3% |
| — range by day 1 entry theoretical bounds | -3.3% to +11.6% |
| Return vs post-spin low | +7.9% |
| Versus benchmarks | |
| S&P 500 over same window | -1.3% |
| Shares & ownership | |
| Shares outstanding Mar 31, 2026 | 667,018,000 |
| Diluted average shares the EPS denominator | 667,018,000 |
| Free float | 665,781,579 100% of shares outstanding |
| Held by institutions | 9% insiders 0.2% |
| Volume & liquidity | |
| Traded per day 20-session median | $223M |
| Normal volume baseline, provisional | 3,290,050 shares · now 0.93x |
| Day 1 volume | 4.6x normal · first week 3.7x |
| Decay | half in 7 sessions · normal by 9 |
Computed from split-adjusted closing prices. Returns are total return — (end price + dividends received − start price) ÷ start price — with no reinvestment assumed.
Price History
Closing price, split-adjusted, with volume below. No dividends have been paid, so price return and total return are the same. Source: Yahoo Finance. Data through Nov 14, 2026.
Raw daily price & volume data
| Date | Open | High | Low | Close | Volume | Float | Turnover | Market cap | Dividend | Split |
|---|---|---|---|---|---|---|---|---|---|---|
| 2026-11-13 | $72.24 | $72.65 | $70.67 | $72.54 | 2,856,100 | 665,781,579 | 0.43% | $48.39B | — | — |
| 2026-11-12 | $72.01 | $73.57 | $69.69 | $72.06 | 3,760,100 | 665,781,579 | 0.56% | $48.07B | — | — |
| 2026-11-11 | $72.14 | $72.89 | $70.96 | $72.10 | 2,632,200 | 665,781,579 | 0.39% | $48.09B | — | — |
| 2026-11-10 | $72.14 | $73.63 | $70.76 | $72.53 | 2,712,500 | 665,781,579 | 0.41% | $48.38B | — | — |
| 2026-11-09 | $70.44 | $73.20 | $70.00 | $72.53 | 3,831,900 | 665,781,579 | 0.57% | $48.38B | — | — |
| 2026-11-06 | $68.67 | $71.41 | $68.19 | $70.14 | 3,488,500 | 665,674,793 | 0.52% | $46.78B | — | — |
| 2026-11-05 | $71.69 | $72.50 | $68.53 | $68.53 | 5,665,100 | 665,674,793 | 0.85% | $45.71B | — | — |
| 2026-11-04 | $72.77 | $73.59 | $71.21 | $71.25 | 5,117,000 | 665,674,793 | 0.77% | $47.53B | — | — |
| 2026-11-03 | $73.02 | $73.44 | $71.90 | $71.95 | 2,005,500 | 665,674,793 | 0.30% | $47.99B | — | — |
| 2026-11-02 | $72.50 | $74.31 | $72.08 | $73.63 | 2,423,300 | 665,688,137 | 0.36% | $49.11B | — | — |
| 2026-10-30 | $73.06 | $73.88 | $71.35 | $72.40 | 3,429,100 | 665,688,137 | 0.51% | $48.29B | — | — |
| 2026-10-29 | $72.48 | $74.73 | $71.93 | $72.68 | 2,397,200 | 665,688,137 | 0.36% | $48.48B | — | — |
| 2026-10-28 | $72.64 | $73.40 | $71.36 | $72.32 | 1,521,400 | 665,688,137 | 0.23% | $48.24B | — | — |
| 2026-10-27 | $73.18 | $74.20 | $71.60 | $72.06 | 2,133,200 | 665,688,137 | 0.32% | $48.07B | — | — |
| 2026-10-26 | $74.59 | $74.90 | $71.58 | $73.94 | 4,418,200 | 665,688,137 | 0.66% | $49.32B | — | — |
| 2026-10-23 | $71.69 | $74.62 | $70.86 | $74.59 | 3,151,000 | 665,688,137 | 0.47% | $49.75B | — | — |
| 2026-10-22 | $72.02 | $73.58 | $71.03 | $71.12 | 2,970,800 | 665,688,137 | 0.45% | $47.44B | — | — |
| 2026-10-21 | $73.89 | $75.50 | $72.79 | $74.76 | 4,168,200 | 665,694,809 | 0.62% | $49.87B | — | — |
| 2026-10-20 | $72.58 | $73.62 | $71.04 | $73.13 | 2,869,900 | 665,694,809 | 0.43% | $48.78B | — | — |
| 2026-10-19 | $72.07 | $73.02 | $70.75 | $72.39 | 4,592,700 | 665,694,809 | 0.69% | $48.29B | — | — |
| 2026-10-16 | $74.15 | $74.62 | $71.74 | $72.18 | 5,450,800 | 665,701,481 | 0.82% | $48.15B | — | — |
| 2026-10-15 | $74.60 | $75.43 | $73.00 | $73.34 | 4,871,900 | 665,701,481 | 0.73% | $48.92B | — | — |
| 2026-10-14 | $75.48 | $76.48 | $73.01 | $74.41 | 3,988,600 | 665,701,481 | 0.60% | $49.63B | — | — |
| 2026-10-13 | $75.43 | $77.39 | $73.65 | $76.94 | 4,591,400 | 665,701,481 | 0.69% | $51.32B | — | — |
| 2026-10-12 | $74.00 | $75.94 | $73.56 | $75.89 | 3,582,000 | 665,701,481 | 0.54% | $50.62B | — | — |
| 2026-10-09 | $72.79 | $73.95 | $71.65 | $73.15 | 5,141,800 | 665,701,481 | 0.77% | $48.79B | — | — |
| 2026-10-08 | $73.86 | $75.19 | $72.55 | $72.79 | 8,109,400 | 665,701,481 | 1.22% | $48.55B | — | — |
| 2026-10-07 | $75.49 | $75.49 | $72.75 | $72.99 | 8,476,300 | 665,701,481 | 1.27% | $48.69B | — | — |
| 2026-10-06 | $71.91 | $74.10 | $71.25 | $72.93 | 7,496,400 | 665,701,481 | 1.12% | $48.65B | — | — |
| 2026-10-05 | $66.60 | $73.66 | $66.60 | $73.33 | 17,090,500 | 665,461,290 | 2.56% | $48.91B | — | — |
| 2026-10-02 | $68.71 | $71.36 | $65.11 | $67.26 | 13,559,100 | 665,461,290 | 2.03% | $44.86B | — | — |
| 2026-10-01 | $66.00 | $75.00 | $65.00 | $68.26 | 15,016,800 | 665,461,290 | 2.25% | $45.53B | — | — |
Close is split-adjusted to current shares. It is not dividend-adjusted: dividends are listed separately, so total return is (end price + dividends received − start price) ÷ start price, checkable by hand. Volume is as-traded.
Short Selling
Bars: shares sold short each day in trades reported to FINRA (off-exchange
trades, roughly half of all volume).
Line: the short share of that volume, averaged over 20 sessions.
Gold points: short interest, the shares sold short and not yet bought back,
reported twice a month, also shown as a percentage of the free float and of
shares outstanding.
Daily short volume includes market makers' routine hedging, so a change in the
share is more informative than its level. Hover for each day's figures.
Sources: FINRA; float from this site's daily share records; shares outstanding
from the company's latest quarterly filing. Data through Nov 13, 2026.
Index-Fund Holdings
Daily positions of State Street's SPDR index funds, by the fund's file date.
These are the index funds whose daily holdings can be collected; iShares and
Vanguard funds, often larger holders, publish holdings that cannot be
collected automatically and appear in the written analysis from their
quarterly filings.
Collection began on October 11, 2026. A fund that drops the stock shows as an
exit.
Source: State Street Global Advisors. Data through
Nov 12, 2026.
Update — November 12, 2026: first results as a listed company, the scenarios, the money and the debt — SELL, target $54 → $53
Rated at the November 11, 2026 close of $72.10. Sources: the third-quarter results release (evening of November 11, 2026) and its schedules, the pro forma financial statements (November 12, 2026), the information statement, the debt exchange results, the separation agreements (8-K of September 29, 2026), the temporary restraining order of October 9, 2026, and a summary of the November 12, 2026 call. The 10-Q is late (a notice was filed on November 10, 2026) and is due about November 16, 2026, so cash flow for the quarter is not yet available. Earlier sections are left as published. This section rebuilds the valuation as three scenarios with weights, adds the money, the debt and the footprint, and corrects an omission in the November 3, 2026 update.
Overview Summary
Vylor’s first quarter as a listed company kept the year on plan. The third quarter is seasonally a loss, and the operating EBITDA loss of $269 million was $67 million deeper than a year earlier on drought in Europe and the move to licensing soybeans in Brazil; for the nine months sales rose 4% to $8.53 billion and operating EBITDA 8% to $2.66 billion, and guidance of about $2.8 billion for 2026 was reaffirmed. Vylor received more in technology royalties than it paid for the first time in about seven years. The dividend and the buyback are back: an appeals court stayed the order freezing them on October 20, 2026 (reported in the press; no company filing), and on October 22, 2026 the board declared $0.13 a share and authorized $3 billion of buybacks, which the November 3, 2026 update missed. The cases are $75.93, $53.82 and $39.41; weighted 10 / 70 / 20, the value is $53.15 and the target moves from $54 to $53. At $72.10 the price implies about an 83% chance of the best case, which needs the plan beaten and a takeover multiple held, and the expected return is −26.3%.
Rating: BUY below $42.52 · ACCUMULATE $42.52–48.32 · HOLD $48.32–59.05 · TRIM $59.05–70.87 · SELL above $70.87 · Target $53
The quarter
| $M | Q3 2026 | Q3 2025 | Change | Nine months 2026 | Nine months 2025 | Change |
|---|---|---|---|---|---|---|
| Net sales | 938 | 944 | −1% (organic −3%) | 8,531 | 8,235 | +4% (organic +2%) |
| Corn | 607 | 586 | +4% | 5,848 | 5,616 | +4% |
| Soybeans | 133 | 179 | −26% | 1,796 | 1,788 | 0% |
| Sunflower and canola | 150 | 135 | +11% | 621 | 550 | +13% |
| Other (cotton, sorghum, wheat and others) | 48 | 44 | +9% | 266 | 281 | −5% |
| Americas operating EBITDA | (84) | (104) | +19% | 2,880 | 2,597 | +11% |
| Rest of the world operating EBITDA | 92 | 134 | −31% | 555 | 568 | −2% |
| Research and corporate | (277) | (232) | (772) | (704) | ||
| Operating EBITDA (margin) | (269) | (202) | 2,663 (31.2%) | 2,461 (29.9%) | +8% | |
| Adjusted operating earnings per share | $(0.42) | $(0.41) | $2.37 | $2.24 | +6% | |
| Earnings per share (pro forma, reported) | $(0.72) | $(0.58) | $1.50 | $1.81 | −17% |
Pro forma for the separation, as reported; operating EBITDA and adjusted earnings are the company’s definitions. Prior-year earnings per share are derived from the reported changes.
- Price rose and volume fell. Price and mix added 6% in the quarter (3% without licensing) and volume took away 9%:
- Brazil soybeans moved to licensing. About 85% of Vylor’s Brazilian soybean business is now licensed to other seed companies and 15% sold under its own brands; the shift cost about $50 million of third-quarter sales, and management says the volume effect ends with this quarter. Licensing margins are about three times branded ones.
- Weather outside the Americas. Volume fell 16% in the rest of the world on the drought in Europe and a late monsoon in India, partly offset by more sunflower in France, Spain and South Africa.
- Licensing turned positive. Vylor became a net licensor in the quarter, receiving more in royalties than it pays others, after about seven years and roughly $700 million of net payments. Net licensing for 2026 is about +$60 million, against roughly +$180 million that one analyst on the call attributed to the earlier plan. The Investor Day target is about $500 million of gross licensing income in 2027 and more than $1 billion by 2035.
- Guidance implies a small fourth quarter, as every year: operating EBITDA of about $140 million and a loss of about $0.02 to $0.12 a share, on full-year sales of about $10.4 billion (estimates from the guidance).
- Separation costs were $99 million in the quarter and $228 million in the nine months; about $21 million remains.
What management said on November 12, 2026
From a published summary of the call; the replay was not checked.
- 2027: no guidance until February 2027. Management called the year “constructive” and declined to confirm an analyst’s $3 billion placeholder for operating EBITDA. Earnings per share should grow about as fast as EBITDA, after a full year of interest on the separation debt and a smaller currency loss (about $0.10 a share, against about $0.20 in 2026).
- 2027 to 2029: operating EBITDA growth of 7–8% a year and about 60% of it converted into free cash flow.
- Acres: about 183 million acres of US corn and soybeans in 2026, possibly slightly lower in 2027. No figure for 2027 corn.
- Cash and debt: fourth-quarter seed collections of $3.5–4 billion bring debt to about $2.5 billion by the end of 2026, from $5.62 billion at September 30, 2026.
- Buybacks: about $1 billion a year, starting at about $250 million a quarter in the first quarter of 2027.
- Products: hybrid wheat launches in the United States in 2027, with about a 10% average yield gain; Enlist E3 soybeans hold about 65% of US soybean acres, gaining in the Midwest and losing in the South; US corn share was “up a little bit”. The litigation was not discussed, according to the summary.
Events since October 13, 2026
| Date | Event | Read |
|---|---|---|
| Oct 20, 2026 | A divided Seventh Circuit panel stays the October 9, 2026 order pending appeal, as reported by Bloomberg Law (no company filing) | Dividends and buybacks are no longer barred; omitted from the November 3, 2026 update (see the notes below) |
| Oct 22, 2026 | The board declares a $0.13 dividend (record date November 30, payable December 7, 2026) and authorizes a $3 billion buyback with no expiry | The capital-return plan of September 15, 2026 is in place; the stock fell 4.9% that day |
| Oct 22, 2026 | The district court stays the states’ case while the Judicial Panel on Multidistrict Litigation decides whether to send it to the firefighting-foam litigation in South Carolina (reported) | The case continues; no hearing date |
| Nov 10, 2026 | Notice of a late 10-Q | Due about November 16, 2026 |
| Nov 11, 2026 | Third-quarter results; 2026 guidance reaffirmed | Above |
| Nov 11, 2026 | MSCI’s November 2026 review deletes New Corteva from the MSCI USA index, effective at the close on November 30, 2026 (MSCI) | Index-fund selling of New Corteva into November 30, 2026; Vylor is not affected |
| Nov 12, 2026 | New Corteva misses and cuts its 2026 guidance; its stock falls about 19% | Vylor was little changed; a weaker New Corteva helps the states’ argument that the separation left it unable to pay (see the litigation below) |
| Nov 23, 2026 | Vylor’s and Corteva’s opening brief in the appeal is due |
Why the stock moved
| Price return | October 1 to 30, 2026 | October 30 to November 11, 2026 | October 1 to November 11, 2026 |
|---|---|---|---|
| Vylor | +6.1% | −0.4% | +5.6% |
| New Corteva | −7.4% | +4.3% | −3.4% |
| Seed and crop peers | −7.6% | +1.7% | −4.6% |
| Russell 2000 (IWM) | +0.1% | +1.3% | +1.5% |
| S&P 500 (SPY) | −1.1% | +0.5% | −0.5% |
Seed and crop peers equal-weighted: FMC, Bayer (ADR) and KWS Saat. Closes from Yahoo Finance; returns from Vylor’s first close of $68.26.
Closing prices rebased to October 1 = 100. Seed and crop peers are equal-weighted: FMC, Bayer (ADR) and KWS Saat (Frankfurt, in euros). New Corteva is the former parent. Russell 2000 and S&P 500 through their ETFs (IWM, SPY). Source: Yahoo Finance closes.
- The rise came in the first week. Vylor rose 9.0% on October 5, 2026, the day New Corteva left the S&P 500, on 17.1 million shares, its heaviest volume; index funds that held both halves sold New Corteva and kept Vylor (inference from the volume and the date). Since then it has closed between $68.53 and $76.94.
- Vylor has moved on its own. Daily moves since October 1, 2026 correlate at 0.37 with the S&P 500 and at no more than 0.16 with New Corteva or the peers.
- The results changed little. The stock was down 0.2% in the early afternoon of November 12, 2026, while New Corteva fell 18.7% and FMC 6.8%.
- Analysts are uniformly positive. Nine published targets from the October 2026 initiations range from $74 to $89, median $84 (UBS $89, Goldman Sachs $87, RBC and BMO $85, Mizuho $84, Oppenheimer $82, Bank of America $78, BNP Paribas $75 with a Neutral rating, Vertical $74); KeyBanc rates it Sector Weight without a target. None rates it a sell, and no target change after the results was found.
The scenarios
The method is the day-one one: 40% a ten-year cash-flow value at an 8.5% discount rate and 3% terminal growth, 30% a multiple of 2027 adjusted operating earnings, and 30% a multiple of 2026 operating EBITDA (about $2.8 billion) less normalized net debt of $2.5 billion, on 667.2 million shares. Run with the day-one inputs, the cash-flow value is $51.91 against the published $52, and the published sensitivity grid is reproduced within $0.60.
| Case | Value | Against $72.10 | Revenue growth 2027–2031 | EBITDA margin by 2030 | Multiples (2027 earnings / 2026 EBITDA) | What it needs |
|---|---|---|---|---|---|---|
| Best | $75.93 | +5% | 6.0% a year | 34% | 28× / 19× | The 2029 plan beaten: licensing, hybrid wheat and the new corn platforms all early; priced at the analysts’ multiples |
| Base | $53.82 | −25% | 3.5% | 30% | 20× / 14× | Management’s 2029 framework delivered ($11.2–11.9 billion of sales, about 30% margin); priced between listed peers and seed takeovers |
| Worst | $39.41 | −45% | 1.5% | 26% | 15× / 11× | A farm downturn: fewer corn acres, seed prices that stall, licensing late; priced like listed seed peers |
Estimates. Depreciation 3.1% and capital spending 3.4% of revenue; working capital 20% of revenue growth; tax 26.5%; growth fades to 3% by 2036; no buybacks modeled. The cash-flow values alone are $69.62, $51.91 and $38.90.
- The multiples carry most of the spread. Even with the best case’s operations, the cash-flow value is $69.62, below the price; the best case clears $72.10 only on the analysts’ multiples (Mizuho’s target is 29.5 times 2027 earnings and 19 times 2027 EBITDA). Seed takeovers were done at about 16–17 times EBITDA (Bayer for Monsanto, ChemChina for Syngenta) and KWS trades at about 6–8 times.
- The worst case is mild in its operations. Its margin holds at 26%, one point below 2026. Seed downturns have been shallow (Corteva’s seed EBITDA fell 9% in the wet 2019 season; DuPont’s agriculture earnings, seed and crop protection together, fell 30% in 2015 with a currency shock), and most of the worst case’s fall is the change of multiple.
One change at a time on the base case (estimates):
| Change | Value | Change |
|---|---|---|
| Multiples 24× / 17× (halfway to the analysts') | $60.91 | +$7.09 |
| Multiples 15× / 11× (listed seed peers) | $45.91 | −$7.92 |
| Discount rate 7.5% / 9.5% | $58.84 / $50.35 | +$5.01 / −$3.47 |
| EBITDA margin 33% by 2030 (the plan beaten) | $56.26 | +$2.44 |
| EBITDA margin 27% by 2030 (2026 held) | $51.39 | −$2.44 |
| Growth 5% / 2% a year | $56.00 / $51.79 | +$2.18 / −$2.03 |
Stress tests on the best-guess value of $53.15 (estimates):
| Test | Value |
|---|---|
| A deeper downturn as the worst case: 2027 EBITDA 15% lower, no growth, the margin back only to 25%, 13× / 9× (worst $30.00) | $51.27 |
| Vylor pays $2 billion to settle the states’ case | $50.15 |
| Vylor pays $5 billion | $45.66 |
| Net debt held at the September 30, 2026 peak of $4.34 billion | $51.22 |
| Stress weights 10 / 40 / 50 | $48.83 |
The analysts’ targets and this one
The target of $53 is 28% below the lowest published target ($74) and 37% below the median ($84). The difference is almost all the multiple.
| Earnings multiple | EBITDA multiple | Value | |
|---|---|---|---|
| Analysts (Mizuho’s basis, on 2027) | 29.5× | 19× | $84 (Mizuho’s target) |
| Best case | 28× | 19× | $75.93 |
| Base case at halfway multiples | 24× | 17× | $60.91 |
| Base case | 20× | 14× | $53.82 |
- The analysts’ targets assume Vylor keeps a multiple above any seed takeover. UBS argues the price already implies about 7% a year EBITDA growth, the low end of management’s 7–8% framework, and models about 10%. The base case here takes the framework as given and prices it between listed peers and takeovers.
The scenarios and the asymmetry
| Weights, best / base / worst | Value | Expected return | Gain to loss |
|---|---|---|---|
| Standard: 25 / 50 / 25 | $55.75 | −22.7% | 0.06 to 1 |
| Best guess: 10 / 70 / 20 | $53.15 | −26.3% | 0.02 to 1 |
| Stress: 10 / 40 / 50 | $48.83 | −32.3% | 0.02 to 1 |
| What the price implies: 83 / 17 / 0 | $72.10 | 0% | — |
The weights are a judgment: the odds of each path over the next two to three years, revisited at each results update. All values are estimates from the model.
- Why 10% on the best case. It needs two things together: growth nearly twice management’s 3–4% target (seed sales grew about 3.4% a year from 2018 to 2025) and a multiple above every seed takeover, held indefinitely. Net licensing is running at about a third of the earlier plan, and the hybrid-wheat yield claim was lowered from 10–20% (May 2025) to about 10% (September 2026).
- Why 70% on the base case. It is management’s own framework, which the first nine months support (operating EBITDA +8%, margin up 1.3 points), priced at the day-one multiples.
- Why 20% on the worst case. Corn acres are expected about 2 million lower in 2027, with breakevens near $4.75 a bushel against a November 2026 USDA price of $4.60, and Pro Farmer calls 2027 possibly “the toughest year yet for farm margins”. Bayer launches Vyconic soybeans against Enlist and its Preceon short corn in 2027. It is not higher because seed downturns have been shallow and Vylor grew sales 4% in the first nine months of 2026 despite fewer North American corn acres.
- What the price implies: with no weight on the worst case, an 83% chance of the best. The market, like the analysts, prices the plan beaten and the multiple held.
| Measure | At $72.10 | Formula |
|---|---|---|
| Expected return (header chip) | −26.3% | (10% × $75.93 + 70% × $53.82 + 20% × $39.41) ÷ $72.10 − 1 = ($7.59 + $37.67 + $7.88) ÷ $72.10 − 1 |
| Gain to loss (header chip) | 0.02 to 1 | (10% × $3.83) ÷ (70% × $18.28 + 20% × $32.69) = $0.38 ÷ ($12.80 + $6.54) |
| Best gain ÷ worst loss | 0.12 to 1 | $3.83 ÷ $32.69 |
Both header chips take the color of the rating band the price is in: BUY green (an expected return of +25% or more with gain to loss of 3 to 1 or better), ACCUMULATE blue (+10% to +25%), HOLD gold (−10% to +10%), TRIM orange (−25% to −10%) and SELL red (below −25%). On the best guess they are green below $42.52 (gain to loss is 18 to 1 there), blue up to $48.32, gold up to $59.05, orange up to $70.87 and red above. At $72.10 both are red, the SELL band; the header shows gain to loss to one decimal, 0.0 to 1 for 0.02.
| Report | Settled | Short | % float | % outst. | Days to cover |
|---|---|---|---|---|---|
| First after the spin | Oct 15, 2026 | 14.99M | 2.3% | 2.2% | 1.8 |
| Latest | Oct 30, 2026 | 13.95M | 2.1% | 2.1% | 4.1 |
The latest share of float is higher than 0 of the 1 earlier reports since the spin. Short interest in shares, with its share of the float and of shares outstanding. FINRA settlement dates; figures are published about eight business days later. Days to cover is short interest divided by average daily volume, as reported by FINRA. Float and shares outstanding on or before each date, from this site's daily share records and the company's filings.
| Volatility, annualized | Last 20 sessions | Last 60 sessions | Since the spin |
|---|---|---|---|
| To November 13, 2026 | 37% | 42% | 42% |
At the last 60 sessions' volatility, one standard deviation over a month is about ±13%, or $64.24 to $81.91 from the $72.54 close; about two months in three end inside that range if volatility holds. The median daily move since the spin is 1.4%.
| Results day | Released | Close before | Close after | Move | Times a median day |
|---|---|---|---|---|---|
| November 11, 2026 | After the close | $72.10 | $72.06 | -0.1% | 0.0× |
Average move on a results day: 0.1% either way, against a median day's 1.4%. The move is measured from the close before the release to the close of the first session after it.
The litigation
- The claim. Fifteen states and Guam sued on October 1, 2026 under Indiana’s voidable-transactions law, arguing that moving the seed business (about $40 billion by their count) out of reach of the legacy and PFAS liabilities, for about $5 billion of cash and debt, was a fraudulent transfer. They ask the court to undo the transfers, hold what Vylor received in trust and bar distributions. The case is in the Southern District of Indiana (No. 1:26-cv-02122) and the appeal in the Seventh Circuit (No. 26-3075).
- Where it stands. The October 9, 2026 order, which found a strong likelihood of success, is stayed pending appeal, and the district court has paused the case while the multidistrict panel decides where it belongs. California’s separate attempt to stop the separation was refused twice on September 30, 2026; its appeal to the Fourth Circuit is pending.
- The precedent is slow. Kerr-McGee spun off Tronox in 2005; Tronox went bankrupt in 2009, a court found a fraudulent conveyance in December 2013, and Anadarko settled for $5.15 billion in April 2014 (Department of Justice). Constructive fraud requires the transferor to have been left unable to pay its debts, which has not been shown while EIDP pays its obligations; New Corteva’s guidance cut on November 12, 2026 weakens that defense at the margin.
- The likelier cost is capital returns frozen again. As an estimate, a renewed freeze within twelve months is about 15% likely and a material payment by Vylor within twelve months under 5%; the stress table above shows $2 billion and $5 billion payments. Legacy and PFAS liabilities stay with New Corteva, which indemnifies Vylor without a cap; liabilities shared and not otherwise allocated split 62% Vylor and 38% New Corteva.
How the money moves
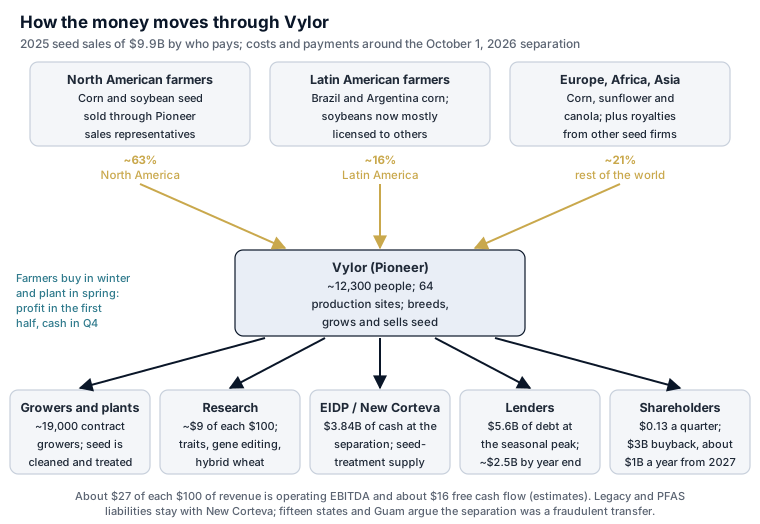
Where each $100 of revenue goes, 2026 (estimate) (Full year 2026, on guidance and nine-month cost shares; the lines below EBITDA are estimates). About $27 of each $100 of revenue is operating EBITDA and about $16 becomes free cash flow, close to management’s target of converting about 60% of EBITDA into cash. Seed is seasonal: almost all the profit is earned in the first half and the cash arrives in the fourth quarter, so the nine-month cash flow is not a guide. Research and development takes about $9 of each $100. Source: the third-quarter results and schedules and the pro forma financial statements; per-$100 figures are calculations.
- Who pays: North American farmers about 63% of 2025 seed sales, Latin America about 16% and the rest of the world about 21%; corn was 69% of nine-month 2026 sales and soybeans 21%. Vylor sells through Pioneer sales representatives in North America and through distributors and licensees elsewhere; about 19,000 contract growers on more than 1.5 million acres grow its seed.
- The year is lopsided. Farmers order and pay in the winter and plant in the spring, so nine months of 2026 earned $2.66 billion of operating EBITDA, the third quarter lost $0.27 billion, and the cash arrives in the fourth quarter. Free cash flow is about $16 of each $100 of revenue over a full year (an estimate), about 60% of EBITDA.
The debt
| Tranche | Amount ($M) | Rate | Matures | Repaying early | Security | Notes |
|---|---|---|---|---|---|---|
| 364-day revolving credit (drawn) | 1,500 | Term SOFR plus a margin | About August 2027 (can be termed out one year) | At any time | Unsecured; Pioneer Hi-Bred co-borrows and guarantees until December 31, 2026 or repayment | Fully drawn on October 1, 2026 to repay the pre-spin bilateral facility |
| Five-year revolving credit (drawn) | 1,578 | Term SOFR plus a margin | About August 2031 | At any time | As above | $1,578M of the $3,000M facility drawn on October 1, 2026; backs the commercial paper |
| 2.300% notes | 435 | 2.300% fixed | July 15, 2030 | Make-whole; par call April 15, 2030 | Senior unsecured, not guaranteed | Issued in exchange for EIDP notes |
| 5.125% notes (2031) | 550 | 5.125% fixed | August 15, 2031 | Make-whole | Senior unsecured | New issue, August 31, 2026 |
| 5.125% notes (2032) | 476 | 5.125% fixed | May 15, 2032 | Make-whole | Senior unsecured, not guaranteed | Issued in exchange for EIDP notes |
| 4.800% notes | 528 | 4.800% fixed | May 15, 2033 | Make-whole | Senior unsecured, not guaranteed | Issued in exchange for EIDP notes |
| 5.625% notes | 550 | 5.625% fixed | August 15, 2036 | Make-whole | Senior unsecured | New issue, August 31, 2026 |
| Total drawn | 5,616 | about 4.7% (the pro forma weighted rate); the notes are fixed; the revolver draws float over Term SOFR | ||||
| Five-year revolving credit | $3,000M | Term SOFR plus a margin | About August 2031 | Unsecured | $1,578M drawn on October 1, 2026 | |
| 364-day revolving credit | $1,500M | Term SOFR plus a margin | About August 2027 | Unsecured | Fully drawn on October 1, 2026 | |
| Commercial paper | Up to $3,500M | Market | Short term | Backed by the revolver | None at the spin |
Before the spin, Pioneer Hi-Bred paid $3,078 million to EIDP (the entity keeping Corteva’s legacy and PFAS liabilities), funded with a bilateral facility, and at the spin Vylor paid EIDP a further $761 million: $3.84 billion of cash in all. Vylor also took on $1,438 million of notes in exchange for EIDP notes and issued $1.1 billion of new notes in August 2026. On October 1, 2026 it drew $1,578 million of its five-year revolver and all $1,500 million of its 364-day revolver to repay the bilateral facility. Pro forma net debt at September 30, 2026 is about $4.34 billion, the seasonal peak: seed cash arrives in the fourth quarter, and management expects year-end debt of about $2.5 billion. Source: the information statement, the exchange results, the pro forma financial statements and the third-quarter results. As of September 30, 2026.
Principal due by year, including scheduled amortization. The revolver draws are short-term: the 364-day facility matures in about August 2027 (extendable a year) and the commercial-paper program is meant to replace bank borrowing. The notes mature from 2030 to 2036.
| Covenant | Limit | Now | Room | Protects |
|---|---|---|---|---|
| Total debt to total capitalization (both revolvers) | 0.60 at most | ~0.31 pro forma at September 30, 2026 (an estimate: $5,654M of debt over $18,233M of debt plus equity) | Wide | The revolving credit facilities |
| Dividends and buybacks | No restricted-payments covenant in the facilities or the notes. A federal court’s temporary order of October 9, 2026 barred them; it was stayed on October 10, 2026 and, as reported (no company filing), stayed pending appeal by the Seventh Circuit on October 20, 2026 | $0.13 dividend declared (payable December 7, 2026); $3B buyback authorized October 22, 2026; buybacks expected to start in 2027 | — | Court orders; tax matters agreement |
| Change of control | Notes: an offer at 101% only with a downgrade below investment grade by every agency within 60 days | No credit ratings disclosed | — | The notes |
| Mergers, asset sales and buybacks (tax matters agreement with New Corteva) | To October 2, 2028: buybacks only within the open-market safe harbor of Rev. Proc. 96-30; no sale of 40% or more of gross assets, merger or liquidation, voting-rights change or proposed acquisition without New Corteva’s consent or an IRS ruling or opinion. Shared liabilities not otherwise allocated split 62% Vylor / 38% New Corteva | In force | — | Tax matters agreement |
The pro forma debt figures are the company’s Article 11 statements; the 10-Q is late under Rule 12b-25 and due about November 16, 2026. Legacy and PFAS liabilities stay with New Corteva, which indemnifies Vylor without a cap; the states’ suit argues the separation itself was a fraudulent transfer.
- The debt peaks at the end of September. At September 30, 2026, pro forma, Vylor owed $5.62 billion and held $1.31 billion of cash: $3.08 billion of floating-rate revolver draws, taken on October 1, 2026 to repay the bridge loan that funded $3.84 billion of cash to EIDP, and $2.54 billion of fixed-rate notes due 2030–2036 at 2.3–5.6%. Fourth- quarter seed collections are meant to repay most of the revolvers, leaving debt of about $2.5 billion at the end of 2026.
- Rates matter only for a few months. Each point on short-term rates costs about $31 million a year on the peak revolver draws, about 3 cents a share after tax for a full year (an estimate), and less once they are repaid.
- Repayment is not a question in either case (estimates):
| Base case | Worst case | |
|---|---|---|
| Debt at September 30, 2026 | ~$5.62B | ~$5.62B |
| Repaid from fourth-quarter 2026 seed collections | − ~$3.08B | − ~$3.08B |
| = Notes left, due 2030–2036 | = ~$2.54B | = ~$2.54B |
| Free cash flow, 2027–2031 | + ~$9.83B | + ~$8.31B |
| Dividends at $0.52 a year | − ~$1.73B | − ~$1.73B |
| Buybacks at about $1 billion a year | − ~$5.00B | − ~$5.00B |
| Notes due by 2031 (the 2030 and 2031 notes) | − ~$0.98B | − ~$0.98B |
| Left | = ~$2.12B | = ~$0.60B |
The 364-day revolver, due about August 2027, and the five-year revolver are assumed repaid from the fourth-quarter collections, as management describes; in the worst case the buybacks would be the first thing cut.
- The covenant is far away. Both revolvers require debt of no more than 60% of debt plus equity; pro forma it was about 31% at the seasonal peak.
- The tax matters agreement allows the buybacks. Until October 2, 2028, repurchases must meet the IRS’s open-market safe harbor for buybacks after a spinoff, and a sale of 40% or more of the assets, a merger or a proposed acquisition needs New Corteva’s consent or an IRS ruling or opinion. A takeover of Vylor before then is unlikely.
Where Vylor works
The information statement counts 64 production sites in about 22 countries without naming them. The maps place 73 sites identified from Pioneer and Vylor pages, news reports, state economic-development releases and job postings; most are located approximately, at the town center.
73 identified sites (42 plants, 17 research stations, 11 offices and distribution centers, the headquarters), against the 64 production sites the filing counts: plants in the US corn belt, Canada, Mexico, Brazil, Argentina and Europe (France, Italy, Austria, Hungary, Romania, Ukraine, Turkey), research stations worldwide. No Asia-Pacific plant could be named. Most pins sit at the town center. Click a point for details. Map data © OpenStreetMap contributors. Source: the information statement (64 production sites in about 22 countries, without names) and, for the sites, Pioneer and Vylor pages, news reports, state economic-development releases and job postings; coordinates from OpenStreetMap. As of November 12, 2026.
North America, 63% of 2025 sales: the corn-belt plants in Iowa, Indiana, Illinois, Nebraska, Minnesota and Michigan, the Johnston headquarters and research campus, and plants in Ontario and Alberta. Click a point for details. Map data © OpenStreetMap contributors. Source: the information statement (64 production sites in about 22 countries, without names) and, for the sites, Pioneer and Vylor pages, news reports, state economic-development releases and job postings; coordinates from OpenStreetMap. As of November 12, 2026.
- Production follows the corn belt. Of the 42 plants placed, 25 are in the United States, most in Iowa, Indiana, Illinois, Nebraska and Minnesota, with others in Ontario, Alberta, Sinaloa, Goiás, Buenos Aires and Santa Fe, and in France, Spain, Italy, Austria, Hungary, Romania, Ukraine and Turkey.
- Research runs in both hemispheres: the Johnston, Iowa headquarters, winter nurseries in Hawaii and Puerto Rico, and stations in Texas, Mexico, Brazil, Argentina, Germany, Turkey, South Africa, India and China.
- The drought in Europe and the late monsoon in India, which cut third-quarter volume outside the Americas by 16%, hit the plants and markets shown on the world map; no Asia-Pacific plant could be named.
Who owns and trades it
Daily volume (bars) and cumulative volume as a share of the 667.3 million shares outstanding (line). Gold bars mark days with a notable event; hover over one to see what happened. Source: this site's daily price archive (Yahoo Finance), through Nov 11, 2026.
- Index funds hold it as a large company. Vylor took Corteva’s place in the S&P 500 on October 1, 2026 (S&P Dow Jones Indices) and is classified as consumer staples: State Street’s holdings files of November 11, 2026 show it in SPY, the S&P 500 Value fund (not Growth) and the Consumer Staples sector fund (1.47%). It is probably in the Russell 1000, MSCI USA and FTSE All-World (secondary sources only); no change of size is expected at the Russell reconstitution effective after the close on December 11, 2026 (preliminary lists from November 13, 2026). It is not yet in any dividend index; the first dividend on December 7, 2026 starts its record.
| Index event | Rule | Where Vylor stands | Dates | Likelihood (judgment) | Which way it trades |
|---|---|---|---|---|---|
| Russell reconstitution | Members are ranked by size on the rank day | A large company; style recalculated only for new members | Lists from November 13; effective December 11, 2026 | No change likely | — |
| S&P 500 share count | Buybacks reduce the index share count at quarterly updates | Buybacks from 2027 | Quarterly | Certain once buybacks start | Small selling |
| Dividend-growth indexes | A record of rising dividends, five to ten years | First dividend December 7, 2026; whether Corteva’s record counts is unclear | 2027 at the earliest | Low near term | Buying |
- New Corteva leaves the MSCI USA index at the close on November 30, 2026, one of 24 US deletions in MSCI’s November 2026 review (MSCI). At about $6.6 billion after its November 12, 2026 fall it will probably move to MSCI’s small-cap index (MSCI does not publish that list), so funds tracking MSCI USA sell New Corteva before that date. Vylor is not on the list and keeps its place.
- Day-one holders were Corteva’s holders, one share for each: at the latest 13F before the spin, Vanguard about 11.8% (June 30, 2026), Fidelity 8.4%, BlackRock 8.1% (June 30, 2026), Capital World Investors 7.4% (up from 6.4% in the second quarter), State Street 5.6% and Geode 3.0%. No one has filed a 13D or 13G on Vylor; third-quarter 13Fs from the largest holders are due by November 16, 2026 and fourth-quarter ones, the first to show Vylor itself, in February 2027.
- No insider has bought or sold in the market. Every Form 4 since October 1, 2026 records shares received in the distribution or director grants of 2,610 shares on October 22, 2026; the chief executive holds 834,809 shares. No Form 144 has been filed.
- Short interest is low and falling: 2.09% of the shares at October 30, 2026 (13.95 million, about four days of trading), from 2.25% at October 15, 2026, against 7.64% at New Corteva (FINRA). Turnover has been light for a spinoff: 23.5% of the shares traded from October 1 to November 11, 2026, against about 144% of New Corteva’s.
- No buybacks have been reported yet. The 10-Q due about November 16, 2026 will show any before September 30, 2026; management expects to start in the first quarter of 2027.
Notes on earlier sections
- Correction: the November 3, 2026 update missed the appeal ruling and the capital returns. It said that “until the appeal is decided, [Vylor] has told the court it will not pay dividends or buy back shares”, and listed the Seventh Circuit’s ruling on the stay as still to come. Vylor’s statement to the court, in its 8-K of October 13, 2026, was limited to the period while its emergency motion was pending. The Seventh Circuit granted the motion on October 20, 2026 (reported by Bloomberg Law; neither company has filed on it), and on October 22, 2026 the board declared the $0.13 dividend and authorized the $3 billion buyback, both confirmed in the third-quarter release. So when the November 3, 2026 update was published, the capital returns had already been restored. A data correction (an omission). It did not affect the rating or the $54 target, which valued the business without buybacks.
- The target is now the weighted value of three cases. The day-one target of $54 combined three methods on one set of inputs; this update uses the same three methods for each case, and its base case reproduces the day-one values. A change of method.
- 2026 guidance is now about $10.4 billion of sales and $2.8 billion of operating EBITDA, against the $10.3 billion and $2,780 million the day-one analysis used. The EBITDA method now uses $2.8 billion; the cash-flow method keeps the day-one starting point. A business change.
- How the buybacks fit the tax matters agreement. The day-one analysis said the filings did not say how about $1 billion a year of buybacks would fit the agreement’s limits. The agreement, filed with an 8-K dated September 29, 2026, allows repurchases that meet the IRS’s open-market safe harbor, which buybacks of about 2% of the company a year can meet. An addition.
The rating and what to watch
SELL, target $54 → $53. The target is the best-guess value, $53.15. At $72.10 the expected return is −26.3%, inside the SELL band (below −25%), and gain to loss is 0.02 to 1: the best case is only 5% above the price, while the base and worst cases are 25% and 45% below it. The price implies an 83% chance that Vylor beats its own plan and keeps a multiple above any seed takeover. The call is close to the edge: SELL starts at $70.87, 1.7% below the close, and the stock would be TRIM below it. It is not TRIM now because the price needs the best case and the results gave no reason to raise its weight, with net licensing at about a third of the earlier plan and a harder 2027 for farmers.
| Action | Level | Reason |
|---|---|---|
| Buy | Below about $42.52 | Expected return 25% or more with gain to loss of 3 to 1 or better |
| Accumulate | $42.52–48.32 | Expected return 10–25% |
| Hold | $48.32–59.05 | Expected return −10% to +10%, around the $53 target |
| Trim | $59.05–70.87 | Expected return −10% to −25% |
| Sell | Above about $70.87 | Expected return below −25% |
| Move the bands up | 2027 guidance at or above about $3.05 billion of operating EBITDA with licensing ahead of plan, or a bid for the company after October 2028 | The best case’s weight rises |
| Move the bands down | 2027 guidance at or below 2026, Vyconic taking Enlist share, or dividends and buybacks frozen again | The worst case’s weight rises |
What the 10-Q, the appeal and the February 2027 results must show:
| Item | Why it matters | The base case needs |
|---|---|---|
| The 10-Q (due about November 16, 2026) | Cash flow, the legal-proceedings note and any events after September 30, 2026 | No new restriction on capital returns |
| The Seventh Circuit appeal (brief due November 23, 2026) and the multidistrict panel’s decision | Whether dividends and buybacks stay allowed | The stay held |
| Fourth-quarter collections | Debt of about $2.5 billion at the end of 2026 | Revolvers mostly repaid |
| 2027 guidance (about February 2027) | The first year of the 2029 framework | Operating EBITDA growth of 7–8%, about $3.0 billion |
| Net licensing | About +$60 million in 2026 | Growth toward the $500 million gross target for 2027 |
| 2027 corn acres (USDA Outlook Forum, February 2027) | About 2 million fewer acres expected | Seed price holding with lower volume |
| Buybacks | About $250 million a quarter from the first quarter of 2027 | Started on schedule |
Update — November 3, 2026: the first weeks and the restraining order — HOLD → SELL, target $54
Rated at the November 2, 2026 close of $73.63. Sources: Vylor’s 8-K of October 13, 2026 on the litigation, its Forms 4, and this site’s price archive. No new valuation: the $54 target is the day-one analysis’s, below, which is left as published.
The one-line version
Vylor still trades above $65, the level at which the day-one analysis said it should move to SELL. At $73.63 it is 36% above the $54 target, an expected return of −26.7%, inside the SELL band (below −25%). Since the first close of $68.26 it has risen 7.9% while the parent, Corteva, fell. A court order now limits what Vylor can do with its cash: until the appeal is decided, it has told the court it will not pay dividends or buy back shares.
What happened since October 1, 2026
| Date | Event | Read |
|---|---|---|
| Oct 1, 2026 | 15 states and one sovereign sue in the Southern District of Indiana, alleging the separation was a fraudulent transfer | The second multistate suit; California’s attempt to stop the separation failed on September 30, 2026 |
| Oct 9, 2026 | The court issues a temporary restraining order: no dividends or buybacks at Vylor or Corteva, no disposals of assets outside the ordinary course | It does not undo the separation |
| Oct 10, 2026 | The court stays the order pending an emergency motion to the Seventh Circuit, relying on Vylor’s statement that it will not declare dividends or repurchase shares while the motion is pending | The fourth-quarter dividend and the planned buyback wait for the appeal |
| Oct 22–26, 2026 | Forms 4: director share grants only | No purchases or sales by insiders |
| Oct 30, 2026 | Close $72.40; the October report re-rates Vylor SELL, target $54 | — |
What the order changes. The day-one analysis valued Vylor on management’s plan, which includes about $1 billion a year of buybacks; at today’s price that is about 2% of the shares a year. While the appeal is pending that money stays on the balance sheet. It does not change the target, because the three methods behind the $54 value the business, not the buybacks, but it removes the one source of steady buying the plan relied on.
What it means for the rating
HOLD (provisional) → SELL, target $54 (unchanged). The day-one analysis set the test: SELL if the stock still traded above $65 after its first week. Five weeks later it is at $73.63. It is SELL rather than TRIM because the price is 36% above a target on which all three methods agree within $3, and the court order removes the buyback that could have supported it. It is not a stronger call because the business still earns its A− grade, and a Seventh Circuit ruling for Vylor would release the capital returns. The SELL band starts at $72.00, so the call is close to the edge: a fall of about 2% would put it in TRIM.
| Action | Level | Reason |
|---|---|---|
| Buy | Below about $43 | Expected return above 25% to the $54 target |
| Accumulate | $43–49 | Expected return 10–25% |
| Hold | $49–60 | Expected return −10% to +10% |
| Trim | $60–72 | Expected return −10% to −25% |
| Sell | Above about $72 | Expected return below −25% |
| Move toward HOLD | The Seventh Circuit lifts the order and Vylor restarts the buyback, or first results above the plan | |
| Stay at SELL | The order is upheld, a third suit, or the price holds above $72 |
There are no scenario cases yet, so the bands are measured against the single $54 target, not a weighted value. A full update at the first results as a listed company will build the cases.
What to watch before the full update:
| Item | Why it matters |
|---|---|
| The Seventh Circuit’s ruling on the stay | It decides whether Vylor can pay dividends or buy back stock |
| First results as a listed company (date not yet announced) | The first standalone margin against the 26.6% of 2025 and the 30% target |
| Any new state action | Each suit extends the period in which capital returns are frozen |
Post-Spin Analysis — October 1, 2026 (day one)
Written against Vylor’s first regular-way close on October 1, 2026, of $68.26, and Corteva’s ex-distribution close of $12.57. This is the day-one analysis; a follow-up next week adds the first week’s trading. Primary sources: Vylor’s final information statement (dated September 24, 2026, filed as Exhibit 99.1 to an 8-K), the 8-Ks of September 30 (the California injunction ruling) and October 1 (completion), the exchange-offer results, and Corteva’s Form 10-Ks for 2019 through 2025, which report this business as the Seed segment. Peer figures are computed from each peer’s own filings. Price and volume are this site’s own archive of the full session, closing auction included.
This is the day-one analysis of Vylor as an independent company. The pre-spin analysis of August 22 remains below, exactly as published.
The one-line version
Vylor is an excellent business that the market priced on its first day as if someone were buying it — and the selling that this site expects after a spin landed on the parent instead.
The business earns its grade. Seven years of Corteva’s own segment reporting show margin rising in every year, from 13.7% to 26.6%, on positive price in every year since 2020 — pricing power, measured, not asserted. The whole senior team — CEO, CFO, CTO and seed head — chose Vylor over New Corteva.
The separation added one risk the pre-spin analysis did not have. California and 18 other states sued to stop the spin as a fraudulent transfer: their case is that EIDP, the entity keeping the PFAS liabilities, gave up its most valuable business for about $3.8 billion in cash and $1.4 billion of debt relief. The injunction was denied twice; the claim was not withdrawn.
The market split the old company 84% / 16%. At $68.26 Vylor trades at about 17.3× estimated 2026 EBITDA — near the top of what acquirers have paid for seed companies, and more than twice listed seed peers — while New Corteva closed at $12.57 after trading 13.2% of its shares in a day. Every method of valuing Vylor on management’s own plan lands at $52–55; the price pays for more than the plan.
Day one, provisional: the rating and target are re-examined in next week’s follow-up.
Rating: HOLD (provisional) · Target $54 · Grade: A− (3.73)
What changed between the pre-spin analysis and the spin
The August 22 pre-spin analysis below was written against an amended Form 10 with several blanks still open. The final information statement of September 24, and the five weeks of filings around it, filled them — and added one fact nobody had priced.
| Pre-spin analysis (Aug 22) | Final (Sep 24 – Oct 1) | |
|---|---|---|
| Distribution | ratio blank | 1 Vylor share per Corteva share, record date September 24 |
| When-issued trading | expected | None — Corteva ruled out when-issued and ex-distribution trading |
| Cash to the parent side | ~$3,560M (estimate) | ≈$3,800–3,850M: $3,078M distributed from Pioneer to EIDP between July 1 and September 24, plus $726–776M more before closing |
| Total borrowings at the spin | $5,579M | $5,668M, against $1,100M of cash |
| Exchanged EIDP notes | 80% take-up assumed | 87.0% / 95.2% / 87.9% tendered — $1,438.6M of Vylor notes |
| Applicable Percentage | blank | Vylor 62% / New Corteva 38% |
| Dividend policy | to be populated | About 15% of annual operating cash flow, quarterly, from the fourth quarter of 2026 |
| A legal challenge to the spin itself | — | California and 18 other states sued to stop it as a fraudulent transfer. Denied; the claim is not withdrawn |
The last row is the one that matters, and it gets its own section below.
What the business actually is
Unchanged in substance from the pre-spin analysis, which covers the franchise, the licensing transition and the competitive position in depth. The figures here are the final ones.
| 2025 net sales | Share | What it is | |
|---|---|---|---|
| Corn | $7,002M | 71% | Hybrid seed with stacked insect and herbicide traits; the core of the franchise |
| Soybeans | $1,878M | 19% | Varieties carrying Enlist E3®, now Vylor’s own trait — no royalty to Bayer |
| Other oilseeds (sunflower, canola) | $644M | 7% | Mostly Europe |
| Other (cotton, wheat, sorghum and more) | $374M | 4% | Includes the hybrid wheat platform |
| Region | 2025 net sales | Share |
|---|---|---|
| North America | $6,271M | 63% |
| EMEA | $1,560M | 16% |
| Latin America | $1,614M | 16% |
| Asia Pacific | $453M | 5% |
From Corteva’s Seed segment disclosures. Vylor now reports two segments — Americas ($7,885M) and Rest of World ($2,013M) — whose segment EBITDA excludes R&D, so it cannot be chained onto the Corteva figures below.
What it sells is genetics, with traits on top. Pioneer® is the number one corn and soybean brand in the United States, and Vylor is a revenue-share leader in Europe corn and sunflower and in Brazil, India, South Africa and Argentina corn. It sells in more than 70 countries, spends about 10% of sales on R&D, and increasingly earns out-licensing income by putting its traits into other seed companies’ germplasm. Growth platforms named in the filing are licensing, gene editing, hybrid wheat and biofuels.
Management Team
The pre-spin analysis recorded that the management team was moving to Vylor. The final filing confirms all of it: the chief executive, the chief financial officer, the chief technology officer and the head of the seed business — the whole senior team — leave Corteva for Vylor.
| Officer | Role at Vylor | Record |
|---|---|---|
| Charles V. Magro | Chief Executive Officer | Corteva’s CEO since November 2021; before that CEO of Nutrien from its 2018 creation to April 2021, and of Agrium 2014–2018 |
| David P. Johnson | Chief Financial Officer | Corteva’s CFO since September 2024; CFO of Atkore 2018–2024; 29 years at Eaton before that |
| Dr. Samuel R. Eathington | Chief Technology Officer | Corteva’s technology chief since 2020; Chief Science Officer of The Climate Corporation (Bayer) 2015–2020; 19 years at Monsanto, latterly head of global plant breeding |
| Judd M. O’Connor | Chief Commercial and Operations Officer | Ran Corteva’s seed business unit from December 2024; North America commercial lead from 2018; DuPont Pioneer before that |
This is the strongest management signal a separation can send. When the parent’s chief executive chooses to run the spinoff rather than the company that remains, it is a revealed preference by the person with the most information about both halves, made before the market can price either. Here it is not one person: the parent’s CEO and CFO both chose the seed business, and New Corteva starts its independent life with a new team. That is the clearest statement available of which half management believes is the prize — and the market agreed on day one (see The market’s verdict).
The board
Seven directors, six independent. Karen Grimes, a former equity portfolio manager and partner at Wellington Management, is non-executive chair. Kerry Preete spent thirty years at Monsanto, latterly as chief strategy officer — the most directly relevant operating experience on the board. The others are Victor Aguilar (P&G’s chief research, development and innovation officer), Marcos Lutz (chair and former CEO of Brazil’s Ultrapar — Brazil is Vylor’s second market), Rajesh Kalathur (former president of John Deere Financial and Deere’s chief information officer), Johannes Oosthuizen (president of Merck’s oncology business), and Magro.
How management is paid
Corteva’s 2026 annual bonus — the plan in force at the spin — measures operating EBITDA (75%) and operating EBITDA margin (25%), and nothing else. The compensation committee removed the free cash flow metric for 2026, because the spin made a full-year cash target hard to set. Long-term awards moved to half performance units, half restricted units, with stock options dropped — a shift the committee described as being for retention through the separation.
There is no return-on-capital measure in the bonus, as with most of the spinoffs on this site, and for 2026 there is no cash measure either. For a business that sells on credit to farmers — bad-debt expense in Brazil rose in the first half — a plan that pays on EBITDA and not on collected cash is the design to watch when Vylor’s own committee sets 2027.
The financial record — seven years of the Seed segment
The Form 10 shows three years. Corteva reported this business as its Seed segment from 2019, never recast it, and the seven-year record changes how the three-year one reads.
| Year | Net sales ($M) | Segment op. EBITDA ($M) | Margin | Price | Volume | Currency | Portfolio |
|---|---|---|---|---|---|---|---|
| 2019 | 7,590 | 1,040 (pro forma) | 13.7% | 0% | −1% | −2% | — |
| 2020 | 7,756 | 1,208 | 15.6% | +1% | +5% | −4% | — |
| 2021 | 8,402 | 1,512 | 18.0% | +4% | +4% | — | — |
| 2022 | 8,979 | 1,656 | 18.4% | +9% | — | −2% | — |
| 2023 | 9,472 | 2,117 | 22.4% | +13% | −6% | −2% | — |
| 2024 | 9,545 | 2,219 | 23.2% | +3% | +1% | −2% | −1% (Russia exit) |
| 2025 | 9,898 | 2,636 | 26.6% | +3% | +2% | −1% | — |
| H1 2025 | 7,244 | 2,705 | 37.3% | +3% | +2% | −3% | — |
| H1 2026 | 7,555 | 3,000 | 39.7% | +3% | — | +1% | — |
Corteva’s Seed segment operating EBITDA, from its 10-Ks and 10-Qs; 2019 exists only on a pro forma basis. Price, volume, currency and portfolio are each year’s percentage change in net sales.
Three things in that table matter.
First, this is not a cyclical margin — it is a structural climb. Margin rose every year from 2019 to 2025, from 13.7% to 26.6%. The driver is the one the pre-spin analysis identified: replacing Bayer’s Roundup Ready 2 Xtend soybean trait with Corteva’s own Enlist E3® — past 45% of North American soybean acres by 2022 — took royalty expense out year after year, and out-licensing turned some of it into royalty income. A spinoff’s first reported year is often a cyclical trough or peak chosen by the parent; here the longer record shows a trend, not a cycle.
Second, the Form 10’s window begins in the price spike. 2023 carried a +13% price increase — the highest in the record — against −6% volume. Price has run +3% a year since, in 2024, 2025 and the first half of 2026. Price has been positive in every year from 2020 through the first half of 2026 (flat in 2019, and negative only regionally — Latin America, −7% in 2024). That is the direct evidence of pricing power: in the 2023 spike the business raised price while losing volume, and kept raising it at a normal rate afterward. Compare a distributor such as ADI Global, which cut price in 2024. Organic volume growth over the record is modest — about 1% a year — so the growth case rests on price, mix and licensing, not on selling more seed.
Third, the business is extremely seasonal, and the first standalone quarters will look bad. In 2025 the first half produced 73% of sales and 103% of segment EBITDA; the third quarter (July–September) lost $193M and the fourth made $124M. Vylor’s first two reported quarters as an independent company will show a seasonal loss or a thin profit. That is the calendar, not a deterioration, and anyone reading the November print against a run-rate will mistake one for the other.
Measuring the join with the standalone figures. Vylor’s carve-out operating EBITDA (which charges R&D and corporate cost) sits below the Corteva segment figure by $129–223M a year:
| 2023 | 2024 | 2025 | H1 2026 | |
|---|---|---|---|---|
| Corteva Seed segment operating EBITDA | 2,117 | 2,219 | 2,636 | 3,000 |
| Vylor carve-out operating EBITDA | 1,894 | 2,090 | 2,423 | 2,830 |
| Gap | 223 | 129 | 213 | 170 |
| of which corporate allocation | 58 | 63 | 76 | 36 |
The information statement explains only the corporate allocation. The rest — $68–178M a year, sitting in cost of goods sold — is not reconciled anywhere in the filing. The most plausible candidate is seed-treatment products bought from the crop protection business ($190–337M a year), but that is an inference, not a disclosure. The valuation below uses the lower, Vylor-basis figure throughout, and the pro forma that adds the commercial agreements with New Corteva — $2,503M for 2025 — as a cross-check.
For 2026: the first half on Vylor’s basis was $2,830M, up 9.5% on the year. With a second half like 2025’s (about −$160M), full-year operating EBITDA lands near $2.65–2.70 billion — my estimate, consistent with the pre-spin analysis’s ~$2.75B. Net income on the pro forma basis was only $325M for 2025, but that carries the one-time $610M Bayer settlement, $201M of separation costs, $489M of amortization and $175M of pro forma interest; the first half of 2026, with none of the Bayer charge, earned $1,487M pro forma.
The seal is contested: nineteen states say the spin is a fraudulent transfer
The pre-spin analysis concluded “Vylor is clean. It is not hermetically sealed.” Five weeks later, the states tested the seal in court.
What happened. On September 14, 2026, California — joined by 18 other states, the District of Columbia, Puerto Rico and nine political subdivisions — asked the U.S. District Court for the District of South Carolina for leave to file a motion to enjoin the spin-off as a fraudulent transfer under California’s Uniform Voidable Transactions Act, on both constructive and actual fraudulent-transfer theories. The court refused on September 15. On appeal, the Fourth Circuit summarily reversed that refusal on September 30 — without expressing a view on the merits — and sent it back; on remand the District Court denied the motion to enjoin, the same day. Corteva’s board then waived the legal-restraints condition to the extent any further order might arrive before closing, and the spin completed on October 1.
Why the states care. The PFAS liabilities stay with EIDP, the legacy E. I. du Pont entity, inside New Corteva. The seed business — Pioneer — was lifted out of EIDP before the distribution. A creditor’s theory writes itself: an entity facing large environmental claims transferred its most valuable business for less than it was worth, leaving the claimants a smaller pot. EIDP received about $3.8 billion in cash from Pioneer, and was relieved of $1.4 billion of its notes, for an asset the market valued at roughly $45.5 billion of equity on its first day. Whether that is “reasonably equivalent value” is now a litigated question, not a rhetorical one.
What the filing says the remedy could be. In its own words, a court that agreed “could void the spin-off or related transactions as a fraudulent transfer or impose substantial liabilities on us … return to New Corteva or its creditors some of our assets or your shares of Vylor common stock or provide New Corteva or its creditors with a claim for money damages against us in an amount equal to the difference between the consideration received by Corteva and the fair market value of us at the time of the distribution.”
What protects Vylor. Three things, in order of weight:
- The injunction was denied twice — the claim did not stop the spin, and an unwind of a completed distribution to hundreds of thousands of holders is a far harder remedy to obtain than a pause.
- Solvency opinions. The boards of Corteva, EIDP and Vylor each received an opinion from an independent valuation firm that each entity was solvent, adequately capitalized and able to pay its debts after the transactions — which is precisely the constructive-fraud test.
- EIDP keeps a capitalized balance sheet: the ~$3.8 billion of cash, the MOU cost-sharing with DuPont and Chemours, and the indemnification assets the pre-spin analysis described.
What it does not do is go away. Denying an injunction is not a ruling on the merits, and nothing in the filings says the underlying claim has been withdrawn. The states can pursue money damages from Vylor for years. This is a contingent liability with no accrual, no disclosed amount and a plaintiff group that includes nineteen states. It is charged once, to Strategic Rationale, below.
Following the money: $3.8 billion to EIDP, funded by Vylor’s balance sheet
The cash moved before the spin, out of the seed business and into the legacy entity. Between July 1 and September 24, Pioneer Hi-Bred — Vylor’s operating subsidiary — distributed $3,078 million to EIDP, funded by drawing a bilateral bank facility; management expected $726–776 million more before closing. At the spin the bilateral facility is refinanced through Vylor’s new $3.0 billion five-year and $1.5 billion 364-day revolving credit facilities.
Vylor’s balance sheet at the spin (management’s estimate as of October 1):
| $M | |
|---|---|
| Cash and equivalents | 1,100 |
| Short-term borrowings (mostly the refinanced bilateral facility) | 3,143 |
| Long-term: Vylor notes issued for exchanged EIDP notes (2.300% 2030, 5.125% 2032, 4.800% 2033) | 1,439 |
| Long-term: new 2031 and 2036 notes | 1,100 |
| Total borrowings | ≈5,680 |
| Net debt | ≈4,580 |
The exchange take-up came in above the filing’s assumption, so long-term borrowings are about $14 million higher than its $2,525 million estimate.
That is a seasonal peak, not a run rate. Seed is sold in the first half and collected through the second; working capital is at its highest around the spin. Management expects debt to EBITDA of 0.8× to 1.1× by December 31, 2026, and targets a long-run ceiling of 2.5×. On 2026E operating EBITDA of about $2.68 billion (my estimate, below), that implies year-end debt of roughly $2.1–2.9 billion — about $3 billion of the peak repaid from seasonal collections in a single quarter.
The weighted coupon on the exchanged notes is low — they were issued by EIDP in better rate conditions — which is a small, real benefit of taking the parent’s debt rather than issuing new.
The market’s verdict: Vylor at the stretch case, Corteva below the bear case
The day’s single most important number is not Vylor’s price. It is how the market split the old company.
| Sept 30 close | Oct 1 close | Share of the combined value | |
|---|---|---|---|
| Corteva (combined) | $77.65 | — | — |
| Vylor | — | $68.26 | 84% |
| New Corteva (CTVA) | — | $12.57 | 16% |
| One Corteva share before = one of each after | $77.65 | $80.83 | +4.1% |
The pre-spin analysis expected New Corteva to keep roughly a third of the value. The market gave it 16%. On the pre-spin analysis’s own fiscal 2026 EBITDA split — about $2.75 billion for Vylor and $1.48 billion for New Corteva — the two halves now trade at:
| Market cap | EV | EV / FY26E EBITDA | |
|---|---|---|---|
| Vylor | $45.5B | $48.0B (year-end net debt ≈$2.5B) | 17.5× |
| New Corteva | $8.4B | ≈$6.7B (≈$1.7B net cash — the pre-spin analysis’s inference, not a disclosure) | ≈4.5× |
Against the pre-spin analysis’s scenarios, the market priced Vylor at its “stretch” case (18×, $67.48) and New Corteva below its “bear” case (8×, $20.25). It is not a re-rating of the whole: one share of old Corteva is worth 4.1% more today than yesterday. It is a near-total transfer of value toward the seed business and away from the half that keeps the history.
And the selling landed on the parent, not the spinco. New Corteva traded 88.4 million shares — 13.2% of the company in one session, about 20× its normal volume — and touched $11.84. Vylor traded only 15.0 million, 2.3% of its shares. The forced selling that follows a separation usually lands on the spinoff, whose new holders did not choose it. Today it ran the other way: the parent was read as the “badco” and sold by holders who owned Corteva for the seed business. That makes New Corteva, not Vylor, the forced-selling candidate in this separation, and it is the subject of the follow-up on the Corteva page.
Price and volume: day one
| Vylor (VYLR) | New Corteva (CTVA) | |
|---|---|---|
| Open | $66.00 | $14.44 |
| High | $75.00 | $14.44 |
| Low | $65.00 | $11.84 |
| Close | $68.26 | $12.57 |
| Volume | 15.0M | 88.4M |
| As % of shares outstanding | 2.3% | 13.2% |
October 1 is a true first session. Corteva ruled out when-issued and ex-distribution trading, so there is no earlier, thinly traded price to confuse with Vylor’s first day.
Vylor’s day was a spike and a fade: it opened at $66.00, ran to $75.00 — 13.6% above the open — and closed at $68.26. The range was 14.6% of the close, wide for a $45.5 billion company. One day is not a pattern; the flush, the day-one low and the volume decay that this site measures all need the first weeks, and they are the subject of next week’s follow-up.
Capital allocation
What management has committed to: a dividend of about 15% of annual operating cash flow, paid quarterly from the fourth quarter of 2026 and expected to grow with earnings; leverage back to 0.8–1.1× by year end and no more than 2.5× over time; research and development at about 10% of sales — $979 million in the 2025 pro forma; and acquisitions limited to adjacencies. Share repurchases are its “preferred method to return capital”: the September 15 presentation states an intention to authorize a $3 billion program in the fourth quarter of 2026 and an annual repurchase target of about $1 billion for 2027–2029, excluding significant M&A.
What the tax matters agreement prevents. For two years from the distribution — until October 2028 — Vylor is prohibited, outside limited exceptions, from mergers or asset sales above a threshold, from issuances, redemptions or repurchases of its stock beyond limited permitted ones, and from changing voting rights. The buyback plan runs straight into that restriction: repurchases of about $1 billion a year — roughly 2% of the company — have to fit within whatever the agreement permits. The pace of the program in 2027 and 2028 is the thing to watch; management has evidently satisfied itself it can be done, but the filings do not say how.
Overhead goes down, not up. Unusually, Vylor expects a reduction in corporate cost after the spin — $58 million a year of labor-based savings in corporate support functions that moved to New Corteva and will not be backfilled — because its pro forma carries all of Corteva’s corporate overhead (the accounting rules allocate none to the discontinued crop protection business). For once, the historical figures are conservative, not flattering: most spinoffs’ carve-out accounts leave out costs a standalone company has to carry; Vylor’s carry more than it will.
Valuation
The capital structure, normalized. About 667.2 million shares (Corteva’s share count at the record date, 1:1) at $68.26 is a market capitalization of $45.5 billion. Net debt at the spin is about $4.6 billion, but that is the seasonal peak; management expects 0.8–1.1× EBITDA by year end, about $2.1–2.9 billion of debt. I use $2.5 billion of net debt as the normalized figure, and show the peak below. Enterprise value about $48.0 billion. Operating leases are excluded.
| Earnings measure | Figure | Multiple |
|---|---|---|
| 2025 operating EBITDA, Vylor carve-out basis | $2,423M | 19.8× |
| 2025 operating EBITDA, pro forma (adds New Corteva commercial agreements) | $2,503M | 19.2× |
| 2026E operating EBITDA — management’s ~27% margin on ~$10.3B of sales | ≈$2,780M | 17.3× |
| 2027E operating EPS on management’s margin path (below) | $2.76 | 24.7× |
My own estimate from the first half — $2,830M plus a second half like 2025’s — is about $2,680M; management’s figure is on the pro forma basis, which adds the commercial agreements with New Corteva and the corporate cost savings.
What management has guided. At its September 15 investor presentation, Vylor set 2027–2029 targets: net sales growth of about 3–4% a year, operating EBITDA growth of about 7–8% a year, an operating EBITDA margin of about 30% in 2029, and free cash flow conversion averaging about 60%. It puts 2026 licensing revenue at about $0.4 billion, expects to be royalty-positive in 2026, and targets $1 billion of net licensing income by 2035, alongside $2 billion of incremental corn revenue and $0.5 billion of soybean revenue by 2035 and $1 billion of hybrid wheat revenue by 2040.
The licensing model raises the margin, not the growth rate. Net licensing income is royalty received less royalty paid, and it falls almost entirely to EBITDA; licensing revenue is small. Even the long-dated targets — about $3.5 billion of new revenue across corn, soybeans and wheat over ten to fifteen years — add up to roughly 3% a year on a $10 billion base. Management’s own revenue target is 3–4%, and nothing in the plan supports growth above 6% a year.
Discounted cash flow
Base case: management’s plan. Assumptions, all stated:
- Starting point: 2026E revenue of $10.3 billion at a 27% operating EBITDA margin (R&D expensed)
- Revenue: five-year growth of 3.5% — the midpoint of management’s 3–4% — fading to 3% by 2036
- Margin: rises to 30% by 2029–2030 and holds — management’s target, which takes 2026–2029 operating EBITDA growth to about 7% a year, the bottom of its 7–8% range
- Depreciation 3.1% of revenue; capital expenditure 3.4% (about $350 million, the 2023–2025 level); working capital 20% of each dollar of revenue growth (seed is sold on credit)
- Tax 26.5% (the 2026 first-half rate); discount rate 8.5%, for an investment-grade, low-cyclicality franchise; terminal growth 3%
- Normalized net debt $2.5 billion; 667.2 million shares; no buybacks modeled
Base case: about $52 a share, 24% below the close. On the peak net debt of $4.6 billion it is about $49.
Sensitivity — terminal margin down the side, five-year growth across the top:
| Terminal margin | 3% | 3.5% | 4% | 5% | 6% | 8% |
|---|---|---|---|---|---|---|
| 26% | $43 | $44 | $45 | $48 | $51 | $57 |
| 28% | $47 | $48 | $49 | $52 | $55 | $62 |
| 30% — management’s target | $50 | $52 | $54 | $57 | $60 | $68 |
| 32% | $54 | $56 | $58 | $61 | $65 | $73 |
| 34% | $58 | $60 | $62 | $66 | $70 | $78 |
About $2 a share per point of terminal margin, and $3 per point of growth. A point on the discount rate is worth about $10 ($64 at 7.5%, $43 at 9.5%).
Read it backwards. At management’s 30% margin, the close of $68.26 needs revenue to grow about 8% a year for five years — more than double management’s own target. Or it needs a margin near 34% with 6% growth, or a discount rate near 7.5%. The market is valuing Vylor as a quality compounder beyond its own plan: the licensing ramp delivered, growth well above anything in the 2020–2025 record, and a lower cost of capital than the 8.5% used here.
Earnings-based cross-check
2027 operating earnings on three margin assumptions, on revenue of $10.66 billion (3.5% growth), with depreciation at 3.1% of revenue, about $150 million of interest at the year-end leverage target, a 26.5% tax rate and 667.2 million shares. Operating earnings exclude amortization of the intangibles created in the 2019 DowDuPont separation, as Corteva’s and Vylor’s own definition does. Management’s targeted buybacks of about $1 billion a year would add roughly 2% a year to per-share figures; they are not included.
| Operating EBITDA margin | EBITDA | Operating EPS | At $68.26 |
|---|---|---|---|
| 26% — a step back from 2026’s 27% | $2,772M | $2.52 | 27.1× |
| 28% — on the path to management’s 30% | $2,985M | $2.76 | 24.7× |
| 30% — the 2029 target, reached early | $3,198M | $2.99 | 22.8× |
Price target
| Method | Value | Weight |
|---|---|---|
| DCF on management’s plan — 3.5% growth, 30% terminal margin, 8.5% | $52 | 40% |
| 20× 2027E operating EPS of $2.76 — combined Corteva’s pre-spin multiple, a premium to listed seed peers’ ~15× | $55 | 30% |
| 14× 2026E operating EBITDA of $2,780M, less normalized net debt — see valuation against peers | $55 | 30% |
| Weighted target | $54 |
The close is 26% above $54. The three methods sit within $3 of each other, which is itself the finding: every way of valuing the business on management’s own plan lands at $52–55, and the market is paying for more than the plan — a multiple above every listed seed peer and near the top of seed takeovers.
What this most resembles
1. The family — a third-generation spinoff. Vylor’s parent was itself a spinoff: Corteva was separated from DowDuPont in 2019, eight weeks after Dow.
| SpinCo | Parent | Spun | vs Day 1 | vs S&P (ann.) |
|---|---|---|---|---|
| Chemours | DuPont | Jul 2015 | +33.3% | −11.6pp |
| Dow | DowDuPont | Apr 2019 | −16.8% | −18.2pp |
| Corteva — Vylor’s parent | DowDuPont | Jun 2019 | +230.8% | +0.9pp |
| Qnity Electronics | DuPont | Nov 2025 | +29.9% | — |
| Vylor | Corteva | Oct 2026 | — | — |
Corteva’s figures run to September 30, the last session before it distributed Vylor; from October 1 its price series measures the crop protection company alone. Qnity has less than a year of history.
Dow and Corteva were separated eight weeks apart and have diverged by about 250 points. The IP-rich, higher-margin business compounded; the commodity chemical business did not. Chemours, which took the legacy PFAS exposure in 2015, trailed the index by nearly 12 points a year. The family’s record splits exactly where Vylor’s separation does — between the business with pricing power and the one carrying the history.
2. Spinoffs from a parent that was itself a spinoff.
| SpinCo | Parent — itself spun from | Spun | vs Day 1 | vs S&P (ann.) |
|---|---|---|---|---|
| Keysight Technologies | Agilent — HP, 1999 | Nov 2014 | +1,089.3% | +9.3pp |
| V2X | Exelis — ITT, 2011 | Sep 2014 | +260.2% | −2.6pp |
| nVent Electric | Pentair — Tyco, 2012 | May 2018 | +632.4% | +11.5pp |
| DXC Technology | Hewlett Packard Enterprise — HP, 2015 | Apr 2017 | −77.8% | −29.7pp |
| Wyndham Hotels & Resorts | Wyndham Worldwide — Cendant, 2006 | Jun 2018 | +34.1% | −11.4pp |
| Vontier | Fortive — Danaher, 2016 | Oct 2020 | +13.0% | −13.7pp |
| BellRing Brands | Post — Ralcorp, 2012 | Mar 2022 | −68.6% | −38.2pp |
| Ralliant | Fortive — Danaher, 2016 | Jun 2025 | +43.2% | +13.6pp |
| ADI Global Distribution | Resideo — Honeywell, 2018 | Aug 2026 | −18.5% | — |
| Vylor | Corteva — DowDuPont, 2019 | Oct 2026 | — | — |
Figures to September 30, 2026. Chosen where both separations are documented; a search by ticker alone also returns false matches where a symbol was later reused. Ralliant’s annualized figure covers only fifteen months.
Being a second-generation spinoff says nothing on its own. Of the eight with an annualized record, three beat the index, and the median trailed it by about 7 points a year — in line with spinoffs as a whole, which trail by about 9. What separates the winners is the business, not the lineage: the two best, Keysight and nVent, are test-and-measurement and electrical-equipment franchises; the two worst, DXC and BellRing, are an IT-services company assembled by merger at the spin and a single-category consumer brand. Vylor’s own record — positive price in every year since 2020 — puts it on the Keysight and nVent side of that line on the business, if not on the price.
Two observations from today:
- The parent took the flush. The forced-selling patterns this site tracks are measured on spinoffs. Today the selling ran at 20× normal volume on New Corteva and about 2.3% of the shares on Vylor. If the next weeks confirm it, Corteva is the first parent-side flush this site has observed.
- A spinco priced at its stretch case on day one. The pre-spin analysis’s own cohort note is worth repeating: across the universe, names that never dipped in their first quarter returned a median +96.4% against +27.6% for names that did — on the prior, adjusted-close method, pending the dip study’s recompute. A strong first day is not, on this site’s data, a reason to expect a reversal.
In depth: competitive dynamics
No change from the pre-spin analysis, which covers Bayer, Syngenta, BASF, KWS and the gene-editing entrants. One development in the final filing: the Bayer disputes were settled in January 2026. Corteva paid $610 million — charged in 2025 as a significant item — dropped its AAD-1 patent claims and terminated the agrobacterium cross-license; in return potential royalty obligations on Enlist E3® soybeans and future royalties under the disputed licenses ended, and new cotton licensing terms were agreed at market rates. “There is no remaining litigation between the parties.” That removes the largest commercial dispute with the one competitor operating at Vylor’s scale.
In depth: valuation against peers
There is no listed comparable at Vylor’s scale. The global seed and trait leaders are divisions of conglomerates (Bayer, BASF) or unlisted (Syngenta, Limagrain’s parent, UPL’s Advanta). The table uses what can be computed from filings and annual reports, at the September 30 close, with foreign currencies converted at that day’s rates.
| Company | Period | Revenue | EBITDA (basis) | Margin | EV/EBITDA | P/E |
|---|---|---|---|---|---|---|
| KWS Saat (seed pure play, Germany) | FY to 6/2026 | €1,627M | €343M reported | 21.1% | 6.8× | 14.6× |
| Sakata Seed (vegetable and flower seed, Japan) | FY to 5/2026 | ¥104.3B | ¥18.6B (op. profit + D&A) | 17.8% | 8.4× | 15.1× |
| FMC (crop protection) | TTM 6/2026 | $3,251M | $741M adjusted | 22.8% | 6.5× | n.m. |
| Nufarm (crop protection, Australia) | TTM 3/2026 | A$3,347M | A$339M underlying | 10.1% | 8.0× | n.m. |
| Corteva, combined, before the spin | TTM 6/2026 | $17,812M | $4,194M operating | 23.5% | 13.0× | 20.4× op. EPS |
| Vylor | FY2025 pro forma / 2026E | $10,067M | $2,503M / ≈$2,780M operating | 24.9% | 19.2× / 17.3× | 24.7× 2027E |
Segments for context, EBITDA before special items, TTM to June 2026: Bayer Crop Science €4,854M on €21,722M of sales (22.3%; seed is about half the division); BASF Agricultural Solutions €2,010M on €9,501M (21.2%); Syngenta AG Seeds, excluding China and ADAMA, $771M on $3,747M (20.6%, computed from operating income plus D&A). Operating leases excluded throughout. FMC’s net debt is pro forma for its September 2026 share sale.
Seed control transactions — EV/EBITDA at announcement:
| Deal | Year | Multiple |
|---|---|---|
| DuPont / Pioneer | 1999 | 22.0× |
| Monsanto / Seminis | 2005 | 13.5× |
| Monsanto / Delta & Pine Land | 2006 | 16.3× |
| BASF / Becker Underwood | 2012 | 14.0× |
| ChemChina / Syngenta | 2016 | 16.8× LTM |
| Bayer / Monsanto | 2016 | 18.0× LTM |
| BASF / Bayer divestiture assets | 2017 | 13.8–15.3× |
The first six as printed by Morgan Stanley in Monsanto’s 2016 merger proxy, not recomputed here; the BASF figure is computed from BASF’s announcements. Each includes a control premium.
On its first day, Vylor trades like a takeover. Listed seed companies trade at 7–8.5× EBITDA and about 15× earnings — smaller, with no global trait platform and lower margins. Combined Corteva traded at 13×. Seed control transactions cluster at 13.5–18×, with Pioneer itself at 22× in 1999. Vylor at 17.3× its estimated 2026 EBITDA sits near the top of the takeover range with no takeover — and, for the reasons in the acquisition section, with no plausible buyer.
A defensible trading multiple is about 14×: a turn above combined Corteva for a pure play with better margins and the trait platform, and at the low end of control transactions since 2012. 14× 2026E operating EBITDA of $2,780M, less $2.5 billion of normalized net debt, over 667.2 million shares, is about $55.
In depth: is Vylor an acquisition target?
Not realistically, and the reasons are size and antitrust before tax.
The clock. The tax matters agreement bars an acquisition of Vylor for two years from the distribution — until October 2028 — and §355(e) presumes any 50% change of ownership within that window to be part of a plan.
The size. At $68.26 Vylor’s equity is worth about $45.5 billion and its enterprise value about $48.0 billion. Very few buyers can write that cheque.
The antitrust. The companies that would want North America’s largest corn and soybean seed brand are the ones antitrust authorities would not let buy it: Bayer is the other U.S. corn and soybean seed leader; Syngenta is owned by the Chinese state; and BASF built its seed business from assets Bayer had to divest to buy Monsanto. A financial buyer at this size would have no precedent in the sector.
§355(e) binds Vylor as acquirer too, which limits stock-funded deals for two years; cash acquisitions remain possible within the leverage target.
What this means for the score: Acquisition Potential is 2.0. It is the weakest dimension and deliberately so; nobody should own Vylor for a takeout.
Tail scenarios
Upside tails
The licensing ramp arrives early (2σ). The pre-spin analysis set out management’s target of +$1 billion of net royalty income by 2035. Half of it by 2030 lifts the operating EBITDA margin toward 32% — two points above management’s own 2029 target; with 6% growth the DCF gives about $65 a share. Even this case sits a little below today’s price: the upside is that it happens sooner, or that gene editing and hybrid wheat add to it.
Scarcity premium (2σ). Vylor is the only listed pure-play seed and genetics company of its size. If it settles at a premium-compounder multiple rather than an ag-inputs one — 22–24× EBITDA, chosen for illustration — the shares are worth $88–96, without any change in the earnings.
Downside tails
The fraudulent-transfer claim produces money damages (2σ). The remedy the filing describes is the difference between what EIDP received and the fair value of what it gave up. Nobody expects a court to award that difference in full; a settlement contribution of $1–3 billion is a more realistic tail, worth $1.50–4.50 a share, before any effect on the multiple. The larger cost may be the overhang itself while nineteen states pursue it.
A farm-income downturn (2σ). Seed is sold on credit; Brazil bad-debt expense rose in the first half. Corn and soybean prices low enough to push farmers down the technology ladder would take margin back toward the 2023 level (22%). At a 26% terminal margin and 3% growth the DCF gives about $43 a share (−37%).
The multiple returns to the pre-spin base case (2σ, and not a stretch). At the pre-spin analysis’s base of 14× fiscal 2026 EBITDA, less year-end net debt, Vylor is worth about $55 a share (−19%). Nothing has to go wrong in the business for this one — only the first-day premium has to fade.
Enlist’s patents expire in 2031–2032 (3σ). The royalty income that drives the margin climb belongs to the current trait generation. If the next generation is late, the climb stalls exactly when the out-licensing target needs it most.
What would change this view
Better:
- Out-licensing income disclosed and growing — the single number that tests the royalty thesis, ideally from the first 10-K
- New Corteva’s flush completing without dragging Vylor — the two now trade on different registers
- The states’ claim dismissed, settled small, or withdrawn
- Year-end leverage inside management’s 0.8–1.1×
Worse:
- Brazil bad debt rising again, or receivables growing faster than sales
- The fraudulent-transfer claim proceeding to discovery on the value question
- A 2027 bonus plan with no cash or return-on-capital measure
- Price/mix turning negative in any reported period — it has been positive in every year since 2020
Dated:
- October 2–9, 2026 — the first week’s trading, the day-one low and the volume decay, for both halves; the follow-up to this analysis
- The fourth-quarter dividend declaration, and the $3 billion buyback authorization management has said it intends — the first tests of the capital-return plan, and of how much buyback the tax matters agreement allows
- Vylor’s first 10-Q, expected November 2026 — the July–September quarter is seasonally a loss; read it against the 2025 quarter (−$193M segment EBITDA), not against a run rate
- Fiscal 2026 results and the first 10-K, early 2027 — out-licensing income, year-end leverage, and the 2027 incentive design
- October 2028 — the tax matters restrictions end; larger buybacks and acquisitions become unrestricted
Thesis-breaking:
- A court ordering any part of the spin unwound, or a damages award that changes investment-grade status
- Negative price/mix for two consecutive years — the pricing-power evidence is the foundation of the grade
Investment Scorecard
| Dimension | Weight | Score | Rationale |
|---|---|---|---|
| Financial Profile | 25% | 4.0 | Margin up every year from 2019 to 2025 (13.7% → 26.6%, segment basis), investment-grade target with leverage back to 0.8–1.1× by year end, and a balance sheet that is conservative by construction — the pro forma carries all of Corteva’s overhead and management expects to cut $58M of it. Held at 4.0 because free cash flow conversion swings widely with farm credit ($429M to $2,160M across 2023–2025) and the first half of 2026 shows rising Brazil bad debt |
| Competitive Position | 25% | 4.5 | The number one corn and soybean brand in the United States, a leader in Brazil, Europe, India and Argentina corn, and positive price in every year since 2020 — through a 13% price spike and the normal years after it. Own-trait replacement of Bayer’s soybean technology is now complete and the disputes are settled. Held below 5.0 because organic volume growth is about 1% a year and the current trait generation’s patents expire in 2031–2032 |
| Strategic Rationale | 20% | 3.0 | A clean two-way separation that put the good asset and the whole management team on one side. Marked down for three facts about how it was done: about $3.8 billion of cash sent to EIDP, funded by Vylor-side borrowing; a 62% share of unassigned liabilities; and a fraudulent-transfer claim brought by nineteen states that the injunction rulings did not dispose of. The claim is charged here, once |
| Management & Governance | 20% | 4.0 | The parent’s CEO, CFO, CTO and seed head all chose Vylor — the strongest management signal a separation can send — and the board carries direct seed-industry and Brazil experience. Marked down for a 2026 bonus on EBITDA and margin only, with the cash metric dropped and no return-on-capital measure |
| Acquisition Potential | 10% | 2.0 | About a $48.0-billion enterprise value, and the natural strategic buyers are the ones antitrust would block. Tax matters restrictions run to October 2028 |
| Weighted Score | 3.73 | ||
| Investment Grade | A− | Strong Opportunity |
What moved and what deliberately did not.
The grade holds at A−: the pre-spin analysis scored 3.80; this one scores 3.73. The new evidence moved two dimensions in opposite directions.
Competitive Position is higher, on the seven-year price record — positive price every year, through a spike and the normal years after it — and the Bayer settlement.
Strategic Rationale is lower, and it is the only place the states’ claim is charged. It would be easy to charge it again to Financial Profile as a contingent liability; it is not, because it has no accrual and no amount, and the leverage that is scored there is the leverage that exists.
The market’s first day moves nothing in the grade. The grade measures the business and the separation; the price is the rating’s job.
Rating: HOLD (provisional). Target $54. The grade and the rating point in different directions, and should: this is an excellent business, priced on its first day as if someone were buying it. At 26% above the target it sits at the edge of a HOLD, and it is a HOLD rather than a SELL only because one session is too little to judge a stock that has not been through its first weeks. If Vylor still trades above $65 once the first-week analysis is in, the follow-up should move it to SELL. Do not buy above $58. Accumulate below $47, where the DCF no longer needs management’s 30% margin target to be met.
All analysis below is pre-spinoff
Written before Vylor Inc. began trading October 1, 2026. Kept as published — figures, valuations and grades reflect what was known at the time, not today.
Pre-Spin Analysis — August 2026
Written August 22, 2026, against the August 21 close of $81.79. Primary source: the Form 10-12B/A information statement filed August 14, 2026 — the first amendment to the June 29 original, and the document that resolves the grade’s outstanding question. Secondary: Q2 2026 results, July 30.
Corteva splits in two on or about October 1, 2026. The seed and genetics business becomes Vylor Inc.; the crop protection business keeps the Corteva name and, with it, the CTVA ticker. Corteva shareholders keep their existing shares and receive Vylor shares on top.
The July 31 report graded this A−, provisional, because the original Form 10 left four blanks: Vylor’s debt, its cash distribution to the parent, the distribution ratio and the record date. The August 14 amendment fills the two that matter and leaves the two that don’t.
The thing that isn’t obvious from the headline
Read the transaction description and you would say Corteva is the parent and Vylor is the spinoff. Legally, that is correct. For accounting purposes it is backwards, and the filing says so in terms.
“Notwithstanding the legal form of the spin-off … for accounting and financial reporting purposes, Corteva’s Crop Protection Business will be presented as being spun-off from Corteva (the reverse of its legal form — a ‘reverse spin’) … Corteva best represents the predecessor entity to Vylor.”
Under ASC 505-60, when the legal spinnee is the larger business, it becomes the accounting spinnor — the successor. Vylor is ~65% of segment profit, so Vylor inherits Corteva’s audited history and Crop Protection is presented as the thing being disposed of.
Three consequences:
1. Vylor lists with seven years of audited financials. A normal spinco arrives with carve-out statements assembled for the occasion, and part of the day-one discount prices that opacity. Vylor arrives with Corteva’s actual consolidated history plus supplemental Seed carve-outs. The usual information asymmetry is smaller here than in almost any spinoff we track.
2. The remaining company is the one with something to prove. New Corteva keeps the name, the ticker and the index seat, and is simultaneously the smaller, lower-margin, structurally-pressured half. A RemainCo in a breakup is effectively a spinoff too. Here GAAP says so in writing.
3. Our own price series for CTVA silently changes meaning on October 1. Same ticker, same legal entity, same CIK — and from that date it measures a $7.5B crop protection company rather than a $17.4B combined one. A continuity break without a ticker break, which no existing guard will catch.
What the amendment actually filled in
| June 29 Form 10 | August 14 amendment | |
|---|---|---|
| Vylor debt at spin | blank | $5,579M total borrowings |
| Cash distribution to parent | blank | ~$3,560M (management estimate) |
| Distribution ratio | blank | still share[s] for every share[s] |
| Record date | blank | still , 2026 |
| NYSE ticker | blank | still " " |
| Dividend policy | blank | “will be populated in an amendment” |
| “Applicable Percentage” | blank | still % |
Two notes on the fine print. The $3,560M is an estimate in the pro forma notes, not a contractual figure — the Separation and Distribution Agreement description still reads “Vylor will distribute approximately $ to New Corteva.” And the Applicable Percentage remains blank, which matters more than it looks: it governs how shared environmental liabilities and any legacy liability that cannot be assigned to either business get split between the two companies.
Vylor’s capital structure at October 1, 2026:
| $M | |
|---|---|
| Cash and equivalents | 1,100 |
| Short-term borrowings | 3,143 |
| Long-term borrowings | 2,436 |
| Total borrowings | 5,579 |
| Net debt | 4,479 |
Long-term debt is $1,280M of Vylor Notes — exchanged out of EIDP’s existing 2030s, 2032s and 2033s at a 4.12% weighted average, assuming 80% of holders tender — plus $1,156M from a delayed-draw term facility or new issuance. The short-term balance is seasonal, and the filing is explicit that working capital is higher at the October spin date than it was at June 30.
Net debt of $4,479M against FY26E EBITDA of roughly $2.75B is 1.63×; against FY25 pro forma EBITDA of $2,503M, 1.79×. Both struck at a seasonal peak in borrowings. Vylor targets investment grade and should get it.
Where management is going
The entire incumbent Corteva C-suite goes to Vylor. Not most of it — all of it, and the filing states the separation twice, in unusually absolute terms:
“After the spin-off, none of our executive officers will be executive officers of New Corteva.”
“While some of these individuals currently serve as employees or directors of Corteva, after the spin-off, none will serve as an employee or director of New Corteva.”
| Role at Vylor | Current role at Corteva | |
|---|---|---|
| Charles V. Magro, 56 | CEO & Director | CEO since Nov 2021; previously CEO of Nutrien and Agrium |
| David P. Johnson, 59 | CFO | EVP & CFO since Sept 2024 |
| Dr. Samuel R. Eathington, 57 | Chief Technology & Digital Officer | Same role; ex-Chief Science Officer, The Climate Corporation; 19 years at Monsanto |
| Judd M. O’Connor, 55 | Chief Commercial & Operations Officer | EVP, Seed Business Unit |
| Karen H. Grimes, 69 | Non-executive Chairman | Corteva director; ex-Wellington Management partner and equity PM |
Vylor’s board will be seven members, six independent.
New Corteva hired from outside. Luke Kissam was named CEO of the crop protection company in April 2026 and joined on June 1. He was chairman, president and CEO of Albemarle until retiring in 2020, and before that held senior legal roles at Albemarle, Merisant and Monsanto.
This is the single clearest signal in the transaction. The management team that knows the combined business chose the seed side, unanimously and without a single crossover appointment. The crop protection company had to recruit a retired specialty-chemicals CEO with a legal background to run it — a coherent hire for a business whose job includes managing legacy liability and a structurally pressured end market, but not the profile of someone brought in to grow something.
Read alongside the liability allocation below, the pattern is consistent: the people and the assets went one way; the history went the other.
The two businesses — and what the revenue line reveals
Corteva reported Q2 on July 30. It beat on earnings, raised full-year guidance — and fell 11.9% the next session on 2.8× average volume, on revenue of $6.38B against roughly $6.6B expected. Adjusted EPS was $2.30 against $2.22.
| Seed → Vylor | Crop Protection → New Corteva | |
|---|---|---|
| Q2-26 net sales | $4,532M (−0.1%) | $1,847M (−3.8%) |
| Q2-26 segment EBITDA | $1,966M (+5.5%) | $342M (+2.4%) |
| H1-26 net sales | $7,555M (+4.3%) | $3,729M (+2.8%) |
| H1-26 segment EBITDA | $3,000M (+10.9%) | $776M (+9.1%) |
| H1-26 EBITDA margin | 39.7% (+235bp) | 20.8% |
Seed sales were flat and crop protection fell 3.8%. But the honest reading is not “the selloff was the half that stays behind” — Seed was expected to grow and did not. Volume fell 3%, offset by 3% price.
Now put three years of Seed alongside each other, which is where it gets interesting:
| FY2023 | FY2024 | FY2025 | 2yr CAGR | |
|---|---|---|---|---|
| Net sales | $9,472M | $9,545M | $9,898M | +2.2% |
| growth | — | +0.8% | +3.7% | |
| Operating EBITDA | $1,894M | $2,090M | $2,423M | +13.1% |
| growth | — | +10.3% | +15.9% | |
| EBITDA margin | 20.0% | 21.9% | 24.5% | +448bp |
Revenue has barely moved. All of the earnings growth is margin. A 2.2% top-line CAGR does not, on its own, support a premium multiple, and the first draft of this analysis treated that as the central risk.
It is not, and the filing explains why. Vylor is deliberately converting a seed-selling business into a trait-licensing business:
“We are executing a strategic transition from being a net licensee of technology to becoming a leading net out-licensor … For 2025, we had gross out-licensing income and net royalty cost of $317 million and $439 million, respectively. We anticipate achieving royalty neutrality in 2026 and expect to grow into a $1.0 billion net royalty income position by 2035.”
That reframes the flat revenue line entirely. Licensing a trait instead of selling the bag reduces revenue and raises margin — and the 2025 commentary says exactly that, citing “the shift to an out-licensing model for soybeans in Brazil” as a volume drag and “increased out-licensing income” as a price/mix gain, in the same sentence.
The swing is large:
| Net royalty position | |
|---|---|
| 2025 actual | −$439M (cost) |
| 2026 target | $0 (neutral) |
| 2035 target | +$1,000M (income) |
A $1.44B swing, against FY25 Seed EBITDA of $2,423M — roughly 59% of today’s earnings, at close to 100% incremental margin. It also explains the $610M Bayer settlement in January 2026, which terminated the Enlist E3 soybean royalty obligations, and why “reductions in net royalty expense” appears in every single EBITDA bridge in the document.
The caution is that these are two indistinguishable stories for two or three years. A deliberate high-margin mix shift and a mature business buying margin with cost cuts and one-time royalty relief look identical from outside. The difference shows up in whether out-licensing income keeps compounding after the cost actions anniversary — and the near-term test is checkable: did royalty neutrality actually arrive in 2026? That lands in the FY26 results, months after the spin.
Full-year guidance was raised to $4.1–4.3B operating EBITDA (~9% growth at the midpoint) and $3.60–3.80 operating EPS (~11%). Separation dis-synergies were cut from an initial $100M estimate to $25M.
Competitive Dynamics
The filing names its rivals in one sentence — “Our key competitors include BASF, Bayer, and Syngenta, as well as regional seed companies” — and then says something more revealing about the industry it operates in:
“While the industry is evolving rapidly, the time and cost to launch new products has only increased, with biotech traits taking approximately 16 years to commercialize.”
Sixteen years is the competitive analysis in a single number. It sets the barrier to entry, explains why the same four companies have held the field for two decades, and — as set out in §5 below — is also why the patent expiry schedule matters more than anything else on this page.
1. Crops, brands and competitive position
| Crop / franchise | Vylor position | Key competitors | Assessment |
|---|---|---|---|
| North America corn | ✅ Co-leader (~30–32% NA corn & soy) | Bayer (DeKalb), Syngenta (Golden Harvest, NK), regional independents | Effective duopoly with Bayer. World-record yield (623.84 bu/ac, 2023) with Pioneer P14830VYHR. Leading tar spot resistance |
| North America soybeans | ✅ Leader on traits | Bayer (Asgrow), BASF (Credenz), Syngenta | Enlist E3 now ≥55% of US soybean acres vs Bayer’s Xtend system at ~45–50%. Z-Series world record 218.29 bu/ac (2024) |
| Europe corn & sunflower | ✅ Technology leader | KWS, Limagrain/Vilmorin, Syngenta, Bayer | Sunflower is a genuine niche strength; EMEA drought has been the recent constraint, not competition |
| Brazil / Argentina corn | ✅ Leader by revenue share | Bayer, Syngenta, regional | Brazil is where the out-licensing model shift is most advanced — soybeans there moved from selling seed to licensing traits |
| India, South Africa corn | ✅ Leader by revenue share | Regional seed companies, Syngenta | Smaller pools, recovering acreage; rice and millet added incrementally |
| Cotton | ⚠️ Entering out-licensing only | Bayer (Deltapine) dominant | Explicitly named as a new addressable market for licensing, not a branded push |
| Hybrid wheat, biofuels | ❓ Pre-commercial | Limagrain, BASF, Syngenta | Named growth platforms. No revenue yet; wheat hybridisation has defeated the industry repeatedly |
2. Market concentration — a durable duopoly
✅ The US row-crop seed market is one of the most concentrated in any industry. Bayer and Corteva together sell 72% of US corn seed and 66% of US soybean seed; the top four control 84% and 78% respectively. Vylor holds roughly 30–32% of the North American corn and soybean seed market, close to level with Bayer.
✅ Barriers are structural, not merely large. A new entrant needs (1) a germplasm library assembled over decades — Vylor claims the largest in the world, spanning more than ten crops; (2) ~16 years and hundreds of millions per biotech trait; (3) regulatory approval in every jurisdiction where the grain may travel; and (4) a route to the farmer. No one has cleared all four since the 1990s.
⚠️ The whole sector is unbundling at once, which is new. Within roughly twelve months: Corteva splits (October 1), Bayer is exiting the glyphosate business it inherited from Monsanto, Syngenta — wholly owned by China’s Sinochem — is preparing a Hong Kong IPO for Q4 2026, and BASF is reviewing a listing of its agricultural unit.
Four of four majors are restructuring simultaneously. For Vylor this cuts two ways: it validates the strategic logic, and it means Vylor will not be the only newly-listed pure-play ag equity competing for the same investor attention in 2026–27.
3. Moats and weak spots
✅ Strongest moat: the Pioneer direct sales channel. Vylor is the only major that reaches farmers through its own agents rather than through retail. The filing describes a model that “walks the acre,” with agents meeting farmers face-to-face across the season and relationships that “extend over multiple generations.” Bayer, Syngenta and BASF sell through dealers, co-ops and retailers. This is the asset a competitor genuinely cannot buy — and it is what lets Vylor introduce test concepts to farmers years before launch and harvest demand signal that rivals see only at order time.
✅ Strong moat: germplasm. Traits get licensed and eventually expire. Germplasm — the underlying genetics the trait is inserted into — does not. It compounds with every breeding cycle, and Vylor’s is the largest pool in the industry. This is the reason the business survives a patent cliff at all.
✅ Strong moat: dual-brand channel coverage. Pioneer premium/direct; Brevant premium/retail outside the US; plus country-specific brands. Vylor can serve the direct farmer and the retail farmer without cannibalising either.
⚠️ Weak spot: revenue growth is not the engine. Seed revenue compounded 2.2% over two years while EBITDA compounded 13.1%. Margin is doing all the work — which is fine while the mix shift runs, and a problem the moment it stops.
⚠️ Weak spot: Vylor is still a net licensee. The filing confirms it “holds multiple long-term biotechnology trait licenses from third parties” and that seed sold to customers “can contain biotechnology traits licensed from third parties.” The 2025 net royalty cost of $439M is that dependency priced. The strategy is to invert it — but the inversion is not complete.
⚠️ Weak spot: extreme seasonality and direct-channel exposure. 75% of sales and substantially all profit land in the first half. And the filing concedes that “our direct distribution channel … is more affected by planting delays than our competitors.” The moat has a weather beta attached.
❓ Emerging threat: gene editing lowers the 16-year barrier. CRISPR multiplexing platforms — Inari’s SEEDesign edits up to 10 genomic targets simultaneously, at a ~$700M Series D valuation — target the trait-development timeline that protects the incumbents. Vylor is itself investing here (gene editing plus internally developed AI, and its One Seed analytics platform). But a technology that compresses trait development from 16 years to five erodes the deepest moat in the industry, and the incumbent with the largest germplasm library has the most to lose from traits becoming cheap.
4. Head-to-head: Bayer Crop Science
⚠️ Bayer is the only competitor operating at Vylor’s scale across the same crops and geographies.
| Dimension | Vylor (Seed) | Bayer Crop Science |
|---|---|---|
| FY25 revenue | $9,898M (seed only) | €21,622M (~$23.4B, seed + crop protection) |
| FY25 EBITDA margin | ✅ 24.5% | ⚠️ 19.4% (before special items) |
| US corn | Co-leader | ✅ Co-leader (DeKalb) |
| US soybean traits | ✅ Enlist E3 ≥55% of acres | ⚠️ Xtend ~45–50%, and soybean seed & traits fell 7.7% in 2025 |
| Route to market | ✅ Own direct agent network | Dealer / retail |
| Germplasm pool | ✅ Largest in industry | Very large (Monsanto legacy) |
| Legacy litigation | ✅ Effectively none | ⚠️ Glyphosate: 100,000+ claims, $7.25B proposed class settlement |
| Balance sheet | ✅ 1.6–1.8× | ⚠️ Heavily levered post-Monsanto |
| Trading multiple | — | 8.8× EV/EBITDA, 10.3× forward P/E |
How Vylor won soybeans, and why that matters now. Bayer’s own 2025 report attributes its −7.7% soybean seed and traits decline to “the cancellation of the registration of dicamba-based products in the United States.” A US District Court vacated the over-the-top dicamba registrations in February 2024, leaving Bayer’s XtendFlex system without its companion herbicide for two seasons. Enlist E3 — built on 2,4-D choline, which never had the same volatility problem — took the acres.
⚠️ Both of those tailwinds are now reversing.
- Dicamba came back. The EPA re-registered Engenia, Tavium and Stryax (Bayer’s renamed XtendiMax) in February 2026 — though only for the 2026 and 2027 seasons, with mitigation requirements. The relief is real but expressly temporary.
- Bayer won at the Supreme Court. On June 25, 2026 the Court held 7–2 in Monsanto v. Durnell that FIFRA preempts state-law failure-to-warn claims where the EPA has made a definitive safety determination. Combined with the $7.25B class settlement — final approval hearing September 14, 2026, two weeks before Vylor lists — the overhang that has constrained Bayer’s crop science investment for eight years is lifting.
The honest framing: Vylor’s soybean share was won partly on merit — the A-Series Enlist E3 varieties show a 3 bu/ac advantage over XtendFlex across 2,462 comparisons with a 71% win rate — and partly on a competitor fighting a regulatory and legal fire. The fire is being put out. A re-capitalised, less distracted Bayer with a working dicamba label is a materially harder opponent than the one Corteva has faced since 2019, and Vylor meets it in its first year as a standalone company.
5. Crown jewel: the trait licensing franchise — and its expiry date
✅ The licensing business is the strategic center of the company. It converts R&D into royalty income earned on acres Vylor does not plant and seed it does not sell — participating “economically in seed markets beyond our branded footprint.” Margins approach 100% incrementally and cash conversion is high.
| Net royalty position | |
|---|---|
| 2025 actual | −$439M (cost) |
| 2026 target | $0 (neutral) |
| 2035 target | +$1,000M (income) |
✅ The patent estate behind it is substantial: ~5,300 US patents, ~2,500 active outside the US, ~2,000 pending applications and ~2,000 trademark registrations.
⚠️ But the estate is front-loaded, and the filing discloses the schedule:
| Remaining life | US patents | Other countries | Cumulative US |
|---|---|---|---|
| Within 5 years | 1,000 | 600 | 19% |
| 6–10 years | 1,800 | 1,100 | 53% |
| 11–15 years | 1,500 | 600 | 81% |
| 16–20 years | 1,000 | 200 | 100% |
More than half the US estate expires within ten years. And the filing is specific about which ones:
“The patents related to certain Enlist® corn and soy biotech traits are set to expire beginning in 2031 through 2032. Patents related to our Qrome® technology … expire in 2032. Patents with respect to our next generation corn and soy biotechnology traits generally are set to expire in the 2040s.”
⚠️ This is the single most important thing on the page, and it is easy to miss. Enlist E3 — the trait that took soybean leadership, that the $610M Bayer settlement was fought over, and that underwrites today’s royalty economics — comes off patent in 2031–2032. The $1.0 billion royalty target is for 2035.
The target therefore does not depend on the franchise Vylor has. It depends on the one it has not yet commercialised. Getting from here to $1B of net royalty income requires a clean generational handoff to the next-generation traits — the ones with 2040s patents — and management has named the milestones: triple-stack corn traits available for out-licensing “as early as 2027” and third-generation above-ground insect traits in corn “by the end of the decade.”
Those two dates are the real test of the thesis, and both fall inside a normal holding period. The 2026 royalty-neutrality milestone tells you the current franchise is working. The 2027 triple-stack availability tells you whether the next one will be.
6. Total addressable market
⚠️ The global seed market is roughly $66–70B, growing to a projected $107–130B by the mid-2030s (~6% CAGR). Corn alone is about 36% of commercial seed revenue.
| Market | Size | Vylor position |
|---|---|---|
| Global commercial seed | ~$66–70B | ✅ ~14–15% share — among the two largest players worldwide |
| US corn seed | — | ✅ Co-leader; Bayer + Corteva = 72% combined |
| US soybean seed | — | ✅ Trait leader; Bayer + Corteva = 66% combined |
| Trait out-licensing | Expanding | ✅ The growth vector — targeting +$1.0B net by 2035 |
| Cotton out-licensing | New entry | ⚠️ Bayer’s Deltapine is entrenched |
| Hybrid wheat / biofuels | Pre-commercial | ❓ Optionality only |
✅ Note what out-licensing does to the addressable market: it lets Vylor earn on acres planted with competitors’ seed. That is a genuine TAM expansion rather than a share fight, and it is why the strategy is worth more than the flat revenue line suggests.
7. Geographic and customer map
The Seed business reports two segments, and the concentration is severe:
| FY2023 | FY2024 | FY2025 | Margin trend | |
|---|---|---|---|---|
| Americas net sales | $7,405M | $7,556M | $7,885M | |
| Americas segment EBITDA¹ | $2,185M | $2,422M | $2,813M | 29.5% → 35.7% (+360bp in 2025) |
| Rest of World net sales | $2,067M | $1,989M | $2,013M | |
| RoW segment EBITDA¹ | $552M | $573M | $600M | 26.7% → 29.8% (+100bp) |
¹ Segment EBITDA is struck before R&D and corporate expense, so the two do not sum to the $2,423M company figure. FY25: $3,413M less ~$995M of R&D ≈ $2,418M.
✅ The Americas are 80% of sales and 82% of segment profit — and essentially all of the margin expansion. The +360bp in the Americas against +100bp in the Rest of World says the mix shift to licensing and the price-for-value strategy are working where Pioneer’s direct channel is strongest, and much less elsewhere.
⚠️ That concentration is the real geographic risk. A US or Brazilian acreage shock, a Midwest weather year, or a corn-to-soybean rotation swing hits four fifths of the business at once. The Rest of World segment is too small and too slow-growing to offset it — 2.2% cumulative revenue growth across three years, with EMEA drought and Turkish Lira and Indian acreage swings as the recurring drags.
⚠️ Customer credit is a live line item. Vylor finances its own seasonal sales, and “higher bad debt expense” appears in both the 2024 and 2025 SG&A walks. Direct distribution means Vylor carries farmer credit that a retail-channel competitor pushes onto the distributor.
✅ Employees: approximately 12,300, about 11% represented by unions or works councils — a light labor footprint for the revenue base, consistent with a business whose costs are R&D and germplasm rather than manufacturing.
What the competitive picture means for the thesis
Three findings, in order of consequence:
- The moat is real but its composition is shifting. Germplasm and the direct channel are durable. The trait patents are not — and the trait patents are what the 2035 royalty target monetises.
- The competitive tailwind is turning into a headwind. Bayer spent 2019–2025 losing soybean share to a deregistered herbicide and a $7B+ litigation overhang. Both are resolving within weeks of the spin.
- The checkable milestones are close. Royalty neutrality in 2026; triple-stack corn out-licensing in 2027. An investor does not have to wait until 2035 to learn whether this works.
Net assessment: the business is stronger than its competitive momentum
✅ On the durable factors, the picture is clearly positive. The germplasm pool is the largest in the industry and compounds rather than expires. The Pioneer direct channel cannot be bought or replicated. The 16-year trait cycle keeps the field to four players. Margins run 24.5% against Bayer Crop Science’s 19.4%, the balance sheet is clean at 1.6–1.8×, and there is no legacy litigation. Nothing found here argues against the quality of the asset — and the management migration points the same way.
⚠️ But on the factors that produced the recent outperformance, it is negative, and the timing is unkind. Vylor’s competitive position today is the best it has ever been — soybean trait leadership, record Americas margins, +360bp in a year. Both of the forces that delivered that are reversing in the same quarter the company lists. Dicamba returned in February 2026, and Bayer won at the Supreme Court on June 25 with its $7.25B settlement due for final approval on September 14 — sixteen days before Vylor begins trading. Bayer’s soybean business fell 7.7% in 2025 because it was fighting a fire. The fire is out.
And the asset that monetises the position has a disclosed expiry inside a normal holding period. Enlist E3 comes off patent in 2031–2032; the $1.0B royalty target is for 2035.
❓ One nuance keeps this from being worse than it looks. A patent cliff in seed is not a patent cliff in pharma. When a drug goes generic, revenue collapses. When a seed trait expires, the germplasm it is bred into stays proprietary, the brand and the channel remain, and hybrid corn does not breed true — farmers buy new seed every season regardless. The cliff threatens the $1B royalty ambition, not the $9.9B seed business.
The verdict is therefore split, and the split is the useful part. The core franchise is a net positive, durable enough to own. The growth narrative — the part that would justify paying a premium — is a net negative on the evidence, because it rests on royalties from traits that expire before the target date, and on share won partly from a competitor who was temporarily incapacitated.
That is the same conclusion the valuation section reaches by an entirely different route. Two independent analyses — one on multiples, one on competitive position — arriving at good asset, full price is worth more than either alone.
The falsifiable version, so this can be marked right or wrong: if Bayer’s soybean seed revenue returns to growth in FY2026 or FY2027 with dicamba back on label, the tailwind reading is confirmed. If Enlist holds ≥55% of acres anyway, the share was won on merit and this section was too cautious. That resolves within about eighteen months.
Where the liabilities go
For a business with chemical-industry ancestry this is the question that governs everything else, and the filing answers it cleanly. The legacy liabilities stay with New Corteva.
The operative language, from the risk factors:
"New Corteva will retain certain liabilities to the extent Corteva is responsible under the Prior Transaction Agreements, including obligations relating to historical PFAS and other environmental liabilities associated with legacy EIDP businesses, other than any such liabilities that are primarily related to the Seed Business."
And the mechanism, from the Separation and Distribution Agreement:
“New Corteva will have, on behalf of us and our subsidiaries … sole and exclusive authority to … defend … settle … all matters whatsoever … If we or any of our subsidiaries incur any indemnifiable losses … New Corteva will be required to indemnify us for all such indemnifiable losses.”
Two structural facts make this stick. EIDP, Inc. — formerly E. I. du Pont de Nemours and Company, the entity that carries the legacy DuPont obligations — remains a subsidiary of New Corteva. And Pioneer Hi-Bred, the seed business, is lifted out of EIDP and into Vylor before the distribution. The legacy vehicle and the clean asset are separated by design.
What New Corteva is keeping
| Matter | Exposure |
|---|---|
| PFAS / PFOA (legacy EIDP) | Under the January 2021 MOU: Chemours 50% vs DuPont+Corteva 50%, capped at $4B of qualified spend over ≤20 years. The DuPont/Corteva half is capped at $2B, split 50/50 on the first $300M then DuPont 71% / Corteva 29%. Corteva’s estimated aggregate share ≈ $600M. MOU escrow held only ~$105M at June 30, 2026 after settlement withdrawals. |
| Chemours counterparty risk | Corteva carries ~$624M of indemnification assets from Chemours ($140M receivables + $484M other assets). If Chemours cannot pay, these become “stray liabilities” cost-shared 29% Corteva / 71% DuPont. |
| Chlorpyrifos / Lorsban | Personal-injury claims against the former Dow AgroSciences alleging autism, parkinsonism and developmental delays from farm-worker and in-utero exposure. Production ended 2020. Accrual established; Corteva is pursuing Dow for indemnification. |
| FTC + 10 state AGs antitrust | Filed September 2022 over crop protection loyalty and rebate programs (acetochlor, oxamyl, rimsulfuron). Settled with the FTC, Arkansas and the MDL plaintiffs, subject to court approval. |
What Vylor is taking
Vylor’s own “Environmental and Other Legal Proceedings” section is two matters and a boilerplate paragraph:
- AltEn, Mead, Nebraska — an ethanol plant that took treated seed as feedstock. Vylor is one of six seed companies in a voluntary cleanup group; an accrual is established for its share.
- AZ Concordia, Chile — a reservoir embankment collapsed in February 2026, flooding government infrastructure. Being resolved with local authorities.
Followed by: “our management does not anticipate that the ultimate disposition of these matters will have a material adverse effect.”
Why this reframes the $3.56 billion
The July report described the structure as “Vylor levers up to pay the parent,” which reads as value extraction — and on the numbers alone it is: Vylor borrows $5.6B and hands $3.56B to New Corteva.
But New Corteva is the entity keeping a ~$600M PFAS obligation, ~$624M of indemnification assets exposed to Chemours’ solvency, an active chlorpyrifos docket and a settled-but-unapproved antitrust matter — while owning the smaller, lower-margin, price-pressured business. Seen that way, the cash distribution is much less like extraction and much more like capitalising the entity that is keeping the history.
That is not a charitable reading; it is the one the structure supports. And it carries a warning for Vylor holders that the indemnity language does not fully dispose of: an indemnity is only as good as the indemnitor. Vylor’s protection from PFAS runs through New Corteva, whose protection runs through Chemours and DuPont. That is a three-deep indemnity chain on a liability with a 20-year tail, and Corteva’s own filing already flags “the solvency of DuPont, Dow and/or Chemours” as a reason its indemnification assets might be worth less than carried.
Vylor is clean. It is not hermetically sealed.
Valuation
Corteva has run +33.1% since announcing the breakup on October 1, 2025 ($61.47 → $81.79). At $81.79 it trades at 21.5–22.7× guided operating EPS and 13.6× FY26E EV/EBITDA — a large premium to the ag complex:
| EV/EBITDA | Fwd P/E | |
|---|---|---|
| Corteva | 13.6× | 21.5–22.7× |
| ADM | 15.8× | 14.1× |
| Bayer (seed + CP) | 8.8× | 10.3× |
| Nutrien | 8.5× | 15.4× |
| Mosaic | 8.0× | 15.2× |
| FMC (pure-play crop protection) | n/m | 6.8× |
FMC deserves a second look, because it is what New Corteva is becoming. A pure-play crop protection company, market capitalization down to $1.4B against $3.9B of net debt, forward earnings at 6.8×. Management’s own commentary — Brazil pricing pressure, generic competition — describes the same forces that did that. New Corteva is far better positioned: larger, better capitalised, a real biologicals portfolio, and $3.56B of incoming cash. But the read-across is not comforting, and it is the reason the crop protection multiples below are struck where they are.
Splitting FY26E EBITDA — Vylor ~$2.75B, New Corteva ~$1.48B, summing to $4.23B against guidance of $4.1–4.3B — on the 1:1 ratio the pro formas assume:
| Case | Vylor mult | Vylor $/sh | New Corteva mult | NewC $/sh | Total | vs $81.79 |
|---|---|---|---|---|---|---|
| Bear | 12× | $42.75 | 8× | $20.25 | $62.99 | −23.0% |
| Base | 14× | $50.99 | 10× | $24.67 | $75.66 | −7.5% |
| Bull | 16× | $59.23 | 12× | $29.09 | $88.33 | +8.0% |
| Stretch | 18× | $67.48 | 13× | $31.31 | $98.79 | +20.8% |
Vylor carries the $4,479M of net debt. New Corteva receives the ~$3,560M and, on our arithmetic, lands near $1.7B net cash — an inference from Corteva’s consolidated position, not a disclosure.
On FY26 numbers the base case sits 7.5% below today’s price. You need Vylor at 16×+ before the sum beats the current quote.
The royalty ramp is the reason that is not the end of the analysis. Every figure above is struck on 2026, the year net royalty merely reaches zero. If the transition delivers even at half pace, the earnings base moves materially:
| Net royalty | Implied Vylor EBITDA | |
|---|---|---|
| FY2026E | $0 | ~$2.75B |
| FY2028E (22% of target) | +$220M | ~$2.97B |
| FY2030E (44% of target) | +$440M | ~$3.19B |
| FY2035 target | +$1,000M | ~$3.75B+ |
At $3.19B of EBITDA, 14× gives roughly $60/share for Vylor alone — the current bull case, on a base multiple, four years out.
Every row below FY2026 in that table assumes a generational handoff. As set out under Competitive Dynamics, the Enlist® traits that underwrite today’s royalty economics expire in 2031–2032 — before the 2035 target date. The ramp is not an extension of the current franchise; it depends on the next-generation traits whose patents run into the 2040s. Treat the 2030 and 2035 rows as conditional on a pipeline that has not yet been commercialised.
So the bull case has a mechanism, not just a re-rating. That is a meaningfully better argument than the one in the first draft of this analysis, which framed the upside as needing Vylor to be re-classified into a different sector. It does not. It needs the licensing transition to be real.
What it also means is that the entry price is doing very little work. Buying at $81.79 asks the buyer to fund a nine-year execution ramp at a full multiple, in a business whose organic revenue has compounded at 2.2%. The asset is excellent and the strategy is coherent. Neither makes today’s price attractive.
One caution worth keeping in view from our own cohort work: across 348 names, those that fell in their first quarter delivered a median total return of +27.6% against +96.4% for those that never dipped. On our data, waiting for post-spin weakness has not historically been the winning move — which argues against treating a first-year drawdown as the plan.
The setup going in
| Pre-earnings high (Jul 29) | $90.51 |
| Earnings reaction (Jul 31) | −11.9% on 2.8× volume |
| Trough (Aug 12) | $75.53 — −16.5% from the high |
| Last close (Aug 21) | $81.79, +8.3% off the low |
| Last four sessions | all higher, volume ~1.0× |
One detail worth recording: the August 14 amendment — disclosing a $5.6B capital structure and a $3.56B cash distribution — landed on a +1.2% day with 0.6× average volume. The most consequential document in the transaction moved nothing.
The family
Vylor is a third-generation spinoff: DowDuPont → Corteva (2019) → Vylor (2026). We hold the whole lineage, and the spread inside one corporate family is the widest of any cohort on the site.
| Company | Parent | Date | Return vs day 1 |
|---|---|---|---|
| Chemours | DuPont | Jul 2015 | +59.5% |
| Dow Inc | DowDuPont | Apr 2019 | −19.6% |
| Corteva | DowDuPont | Jun 2019 | +244.8% |
| Qnity Electronics | DuPont | Nov 2025 | +32.9% |
| Vylor | Corteva | Oct 2026 | — |
Dow and Corteva were separated by eight weeks and have diverged by 264 percentage points. The IP-rich, high-margin businesses compounded; the commodity chemical business did not. Chemours — the one that took the legacy PFAS exposure — is the cautionary member, and its solvency is now an input into New Corteva’s balance sheet.
Vylor is unambiguously on the Corteva side of that line.
Rating
A−, and the provisional flag comes off.
The July grade was scored 3.80 with Financial Profile marked without a leverage input. That input now exists and it is favorable: 1.6–1.8× net leverage at a seasonal peak, an investment-grade target, a 4.12% weighted-average coupon, and dis-synergies cut to a quarter of the original estimate. The liability allocation and the management migration both read favorably for Vylor as well. Score stays 3.80; the dagger comes off.
What that grade is not saying is that the stock is cheap. It is a judgment on transaction quality — a clean two-way separation, the good assets and the whole management team on one side, the history on the other, moderate leverage, and a coherent strategic reason to exist. On price, Corteva has already captured most of the re-rating.
The asset is excellent. The entry is not obviously attractive. Both belong on the page.
What to watch
| When | What | Why |
|---|---|---|
| Before Oct 1 | S&P index decision on Vylor | Determines whether a forced-selling flush happens at all. Announced in advance — knowable, not inferred |
| Before Oct 1 | Final amendment: ratio, record date, ticker, dividend policy, Applicable Percentage | The last two have real consequence: dividend for valuation, Applicable Percentage for shared-liability exposure |
| Before Oct 1 | Exchange offer take-up vs the 80% assumption | Moves the Vylor/EIDP debt mix, not the total |
| At the spin | When-issued vs regular-way volume | The CDK trap — the tell is volume, not price |
| FY2026 results | Did net royalty actually reach neutrality? | The first checkable milestone on the entire licensing thesis |
| 2027 | Triple-stack corn traits available for out-licensing | The single best test of the licensing thesis — Enlist expires 2031–32, so the 2035 target rests on this generation, not the current one |
| FY26–FY27 | Bayer soybean seed revenue, with dicamba back on label | Tests whether Vylor’s share was won on merit or on a competitor’s incapacity |
| Q4 2026 | New Corteva’s first standalone print | Brazil crop protection pricing is the live risk |
| Ongoing | Chemours’ balance sheet | Sits under New Corteva’s indemnification assets, which sit under Vylor’s PFAS indemnity |